Brenda A. Wilson - Bacterial Pathogenesis
Здесь есть возможность читать онлайн «Brenda A. Wilson - Bacterial Pathogenesis» — ознакомительный отрывок электронной книги совершенно бесплатно, а после прочтения отрывка купить полную версию. В некоторых случаях можно слушать аудио, скачать через торрент в формате fb2 и присутствует краткое содержание. Жанр: unrecognised, на английском языке. Описание произведения, (предисловие) а так же отзывы посетителей доступны на портале библиотеки ЛибКат.
- Название:Bacterial Pathogenesis
- Автор:
- Жанр:
- Год:неизвестен
- ISBN:нет данных
- Рейтинг книги:5 / 5. Голосов: 1
-
Избранное:Добавить в избранное
- Отзывы:
-
Ваша оценка:
Bacterial Pathogenesis: краткое содержание, описание и аннотация
Предлагаем к чтению аннотацию, описание, краткое содержание или предисловие (зависит от того, что написал сам автор книги «Bacterial Pathogenesis»). Если вы не нашли необходимую информацию о книге — напишите в комментариях, мы постараемся отыскать её.
Completely revised and updated, and for the first time in stunning full-color, Bacterial Pathogenesis: A Molecular Approach, Fourth Edition, builds on the core principles and foundations of its predecessors while expanding into new concepts, key findings, and cutting-edge research, including new developments in the areas of the microbiome and CRISPR as well as the growing challenges of antimicrobial resistance. All-new detailed illustrations help students clearly understand important concepts and mechanisms of the complex interplay between bacterial pathogens and their hosts. Study questions at the end of each chapter challenge students to delve more deeply into the topics covered, and hone their skills in reading, interpreting, and analyzing data, as well as devising their own experiments. A detailed glossary defines and expands on key terms highlighted throughout the book. Written for advanced undergraduate, graduate, and professional students in microbiology, bacteriology, and pathogenesis, this text is a must-have for anyone looking for a greater understanding of virulence mechanisms across the breadth of bacterial pathogens.
Bacterial Pathogenesis — читать онлайн ознакомительный отрывок
Ниже представлен текст книги, разбитый по страницам. Система сохранения места последней прочитанной страницы, позволяет с удобством читать онлайн бесплатно книгу «Bacterial Pathogenesis», без необходимости каждый раз заново искать на чём Вы остановились. Поставьте закладку, и сможете в любой момент перейти на страницу, на которой закончили чтение.
Интервал:
Закладка:
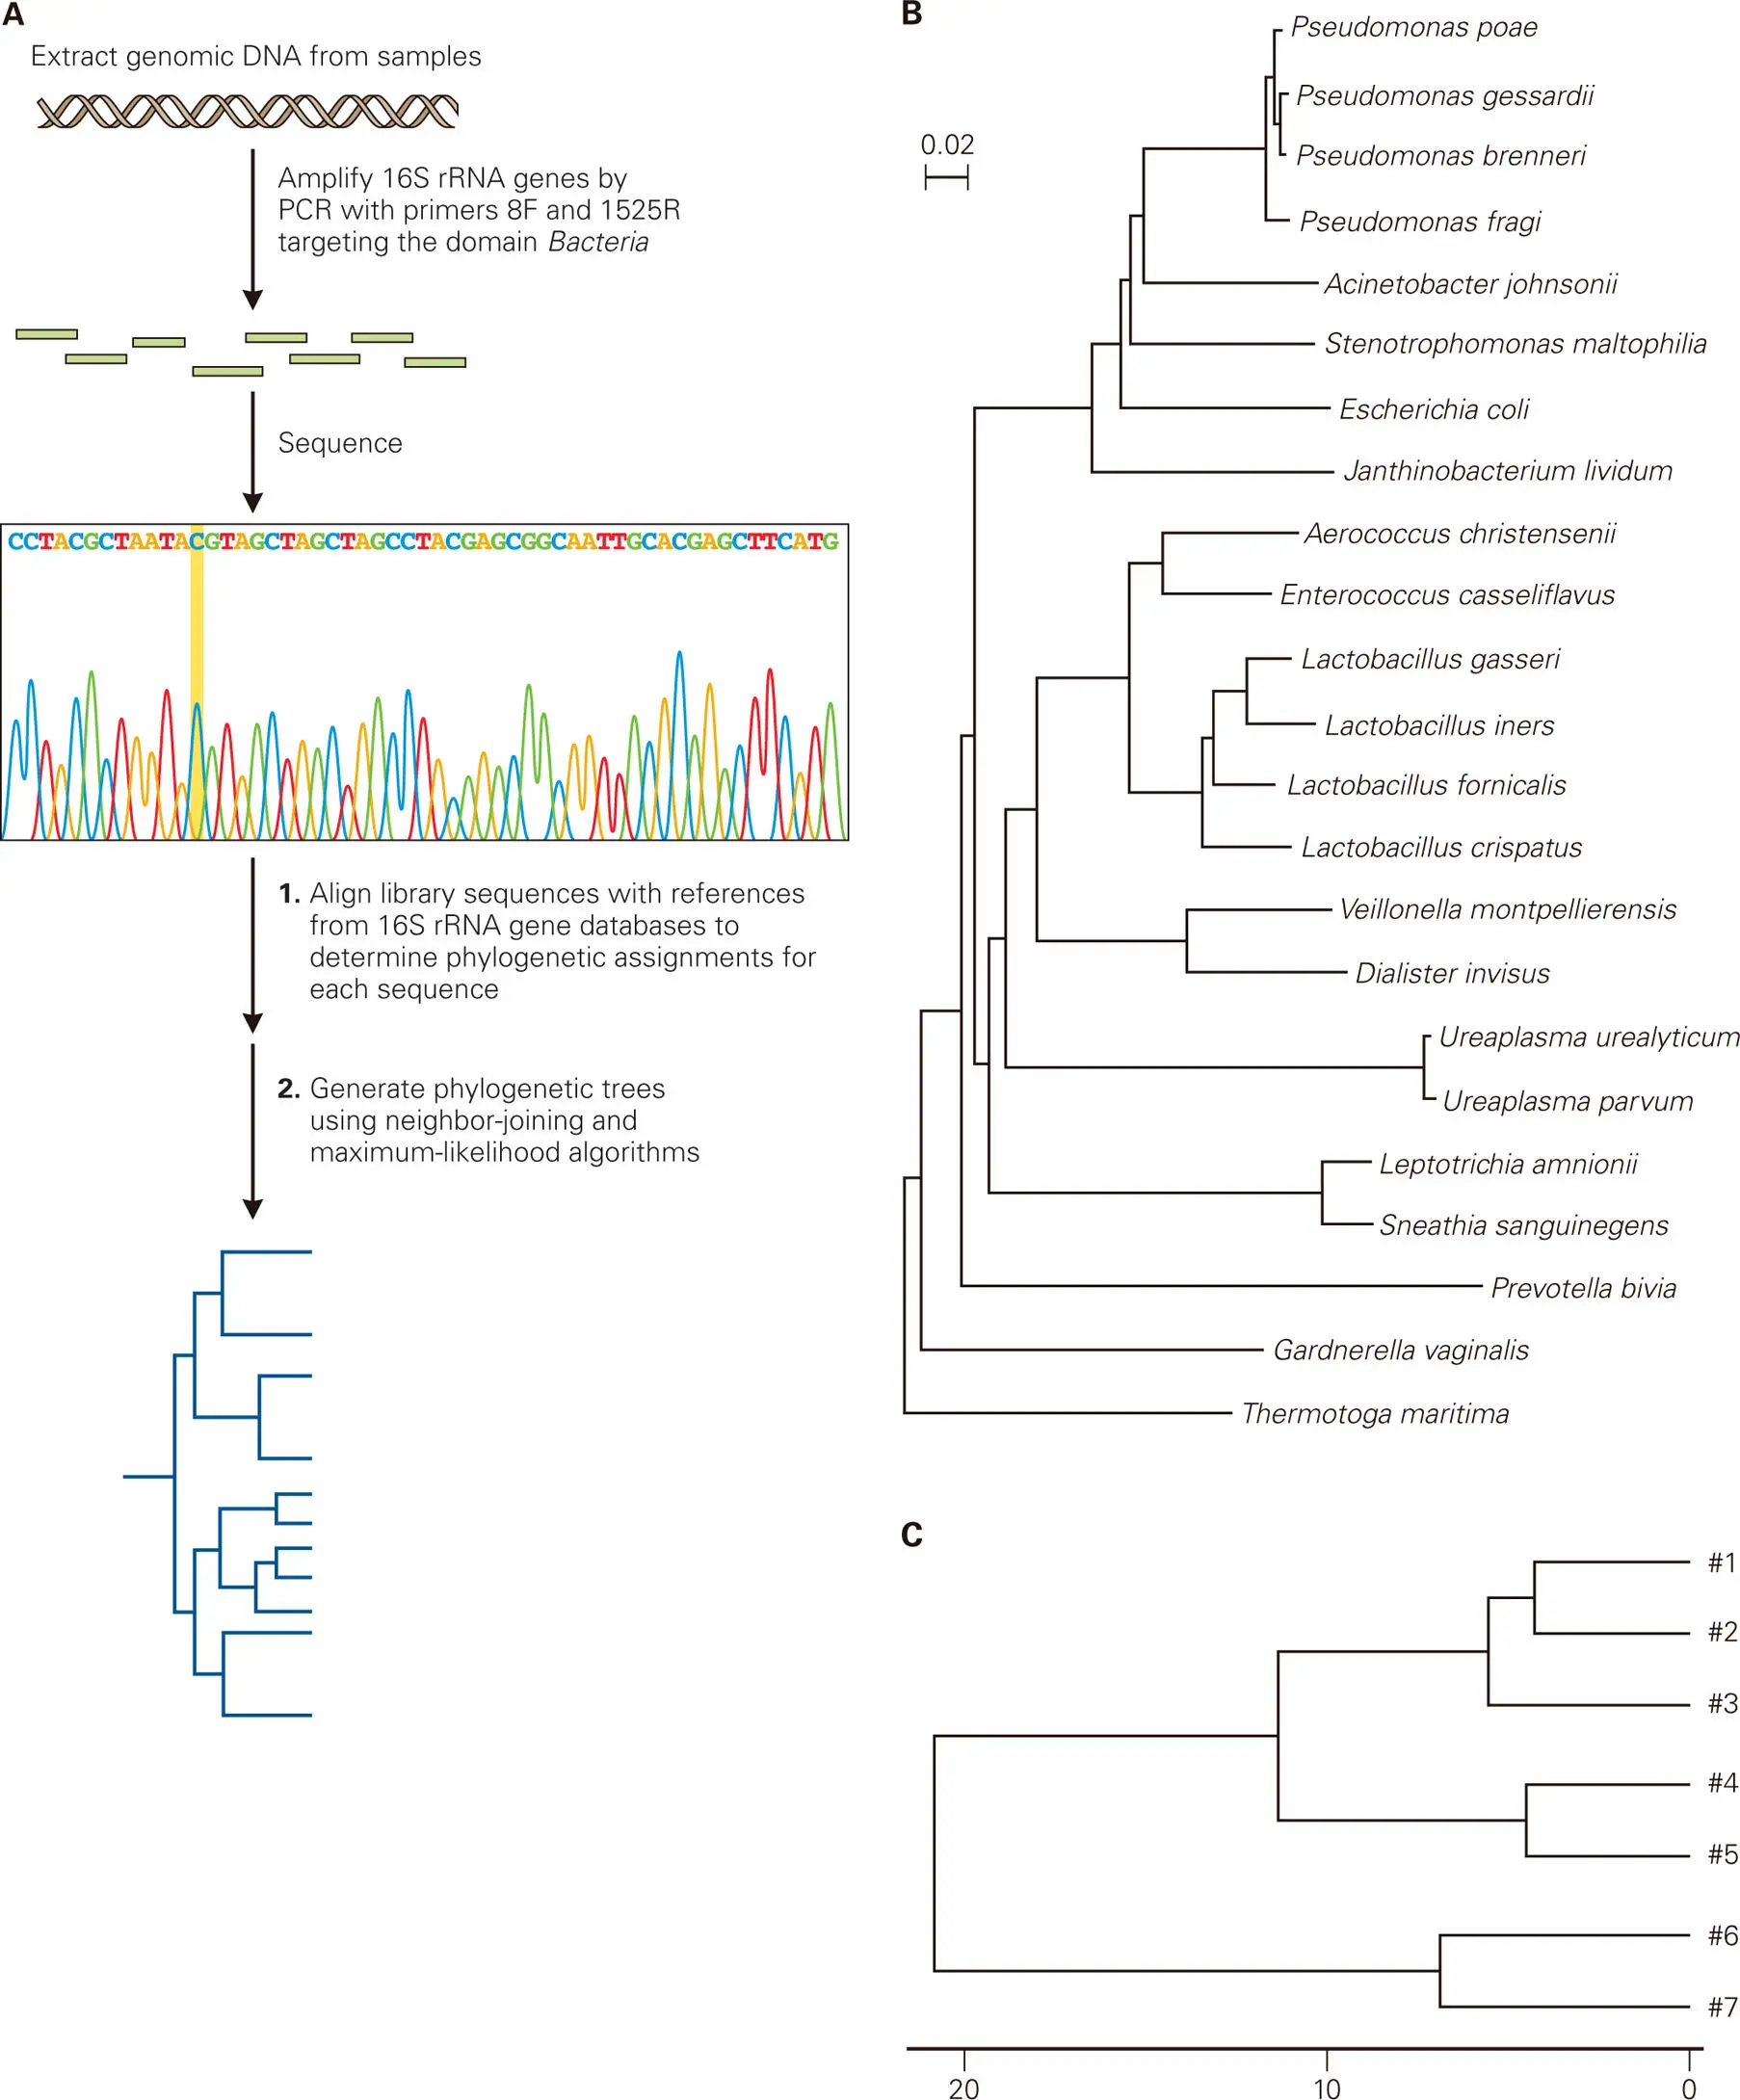
Figure 5-2. Phylogenetic trees to show relationships among microbial communities. Phylogenetic trees are used to illustrate ways rRNA gene sequence data can be displayed to show inferred evolutionary relationships among microbial communities based upon sequence similarities of the microbes with each other. (A) Shown are the steps used to generate a phylogenetic tree based on PCR amplification and sequencing of the nearly full-length 16S rRNA gene sequences (8–1,492) using the commonly used bacterial primer pair (27F + 1492R). (B) The phylogenetic tree shown here displays the phylogenetic relationships among the bacteria found in the vaginas of healthy women. The scale bar represents 0.02 nucleotide substitutions per site in the 16S rRNA gene sequences. (C) Shown is an example of a dendrogram (tree) of the phylogenetic relationships of the bacterial communities from seven different human vaginal microbiota samples, based on their 16S rRNA gene sequence profiles (similar to the one shown in panel B). The lines denote the phylogenetic distance between each of the samples, which is a measure of the relationship or similarity of one sample to the other. For example, samples #4 and #5 are about 10% different from each other (the lines, or branches of the tree, converge at around 5% on the bar index at the bottom), whereas samples #6 and #7 are about 40% different from all of the other samples (#1–#5).
Another common method for depicting phylogenetic relationships or similarity (in terms of distance from each other) among microbial profiles is to use mathematical ordination methods, which are multivariate algorithms in which species units (taxa) or distance profiles of communities are clustered (or ordered) along gradients. One such method, called principal component analysis (PCA), generates a PCA plot from a microbial community data matrix, in which rows are taxa (or relative abundance or similarity distance) and columns are samples ( Figure 5-3A). In a PCA plot, the observed data are mathematically transformed into a coordinate system (x,y-plot or x,y,z-plot), such that the data are projected to fit within the plot, where each axis (coordinate) represents a variable called a principal component (PC). The x axis (PC1) represents the component with the greatest variance (i.e., has the factor 1 that accounts for most of the variability in the data) and the orthogonal (perpendicular) y axis (PC2) represents the component with the second greatest variance (i.e., has another factor 2 that accounts for the next highest variability in the data). As for a phylogenetic tree, the closer the points are clustered together, the more similar the sample profiles are to each other ( Figure 5-3B).
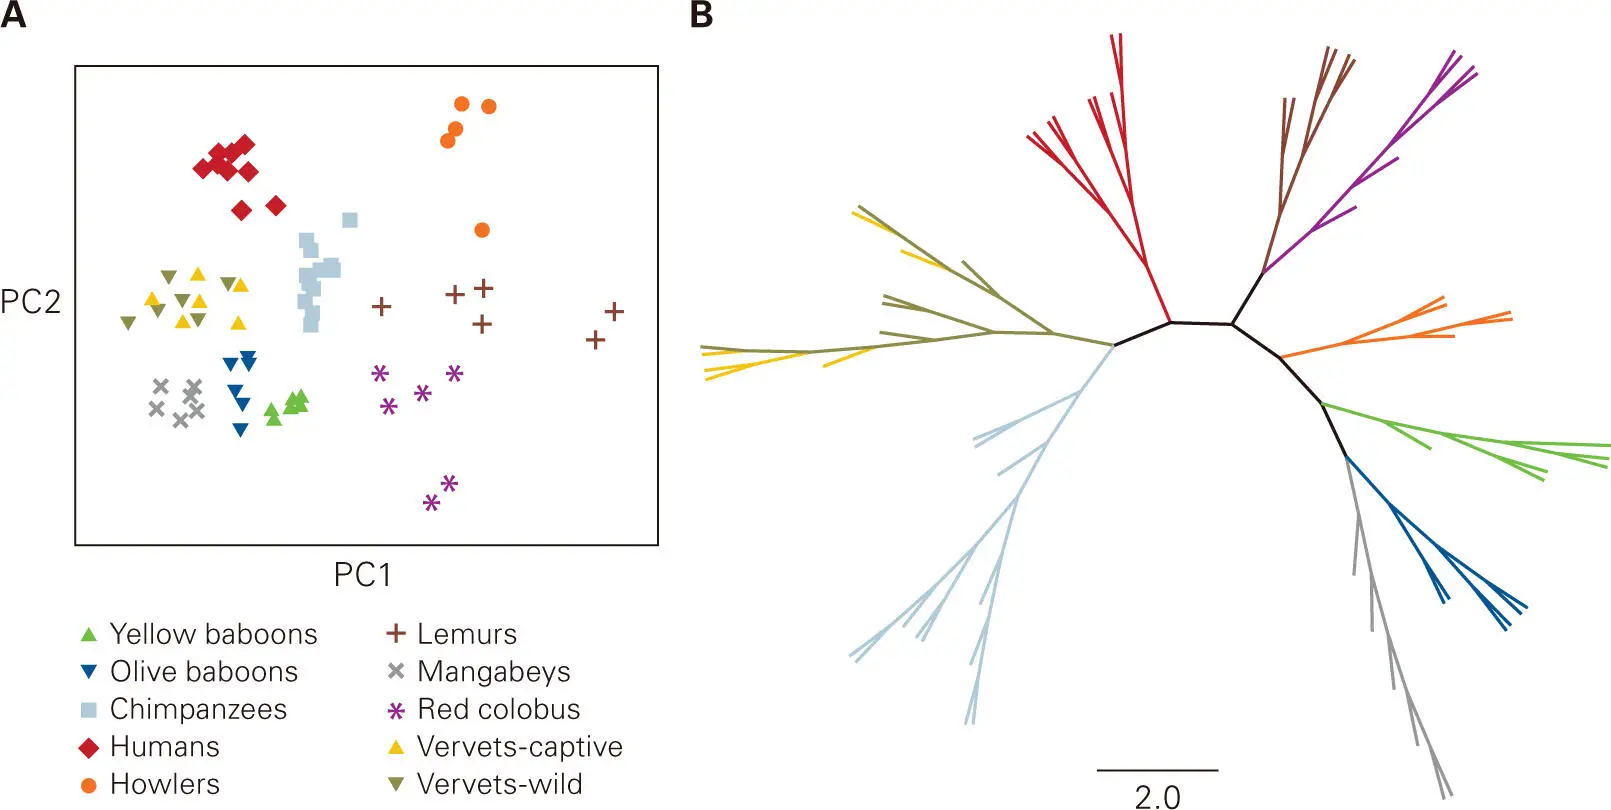
Figure 5-3. Principal component analysis to show relationships among microbial communities. A principal component analysis (PCA) plot is a tool for identifying patterns in data by highlighting their similarities and differences. The PCA plot is generated by a statistical program that uses orthogonal (perpendicular) transformation to convert the observed data (which fall within the area shown) into an ordinate plot. The first principal component (PC1) accounts for the largest variation in the data, which is attributed to factor 1, and the second principal component (PC2) accounts for the second-largest variation in the data, which is attributed to factor 2. Shown is a PCA plot (A) and the corresponding radial phylogenetic tree (a phylogenetic relationship tree that does not make assumptions about ancestry, in contrast to the trees shown in Figure 5-2) (B) based on 16S rRNA sequence profiles depicting the relationship among the vaginal microbiotas of humans and nonhuman primates. Vaginal samples are color-coded to match their host species. Data from Yildirim S, Yeoman CJ, Janga SC, Thomas SM, Ho M, Leigh SR; Primate Microbiome Consortium, White BA, Wilson BA, Stumpf RM. 2014. ISME J 8:2431–2444.
In this way, 16S rRNA gene-based profiling can be used to characterize the content of complex microbial populations, such as those found in the colon or vagina, and enables researchers to compare the relative compositions of microbial populations within an individual and among multiple individuals. Microbiota profiles from individuals who are healthy should resemble one another (i.e., be more closely related in terms of composition), whereas profiles from individuals suffering from a particular type of infection or disease should likewise resemble each other, but be different from the profiles of healthy individuals. Consequently, comparative analysis can serve to distinguish microbiota profiles among individuals and provide some diagnostic assessment of an individual’s health status.
Cultivation-based studies took many years to complete a census for the human vaginal tract and came to the conclusion that Gram-positive Lactobacillus species were the dominant bacteria (present at over 90%) in most healthy women. It was believed that this Lactobacillus-dominant composition only changed during overt infection or symptomatic disease. The cultivation-independent studies using 16S rRNA gene-based microbial content analysis of the human vaginal tract showed no big surprises ( Figure 5-2). Lactobacillus species were still the numerically dominant bacteria present in the population (at 80–90%), with the minor bacterial components being mostly other Gram-positive Firmicutes, such as Staphylococcus and Streptococcus species, Gardnerella vaginalis, and a few Gram-negative Proteobacteria, such as E. coli and Pseudomonas species. However, the phylogenetic DNA-based analysis did reveal a number of species-level differences in Lactobacilli content from the outcomes of cultivation-based studies, as well as considerable person-to-person, species-level variation in the non-Lactobacilli bacteria present. One finding that challenged some previous assumptions about what constitutes vaginal health was the finding that G. vaginalis, which previously was thought to be only associated with overgrowth during symptomatic bacterial vaginosis (BV), is actually a common constituent of the normal microbiota of asymptomatic, apparently healthy women.
One question that a researcher might ask in developing an animal model of disease that manifests with a shift in the normal microbiota composition is if animals, such as laboratory rodents that are often used as models for human disease, have a microbiota that is similar to that of humans. And, if not, would another animal such as a nonhuman primate serve as a more appropriate animal model? To address this issue, a researcher might compare the 16S rRNA gene profiles of the microbiota at particular body sites in potential animal models. An example that may help you appreciate this decision process is provided by a study to determine whether baboons could serve as an appropriate animal model for studying the microbiota of the human vaginal tract.
Why baboons? The reason for choosing baboons is that anatomically, hormonally, and reproductively, the baboon and human uteruses and vaginas resemble each other closely, and both are clearly different from that of rodents, such that mice or rats might be considered to serve as poor models for human vaginal disease. Baboons have been widely used as an animal model in gynecological and reproductive studies of the female genital tract. Topics of these studies have ranged from endometriosis to the efficacy of birth control methods to menopause. Baboons are easier to house and more accessible to researchers than chimpanzees, another candidate for an animal model. Since the captive animals have the same diet and the same environment, this study also provided a chance to ask whether the considerable individual-to-individual differences seen in the human subjects were due to differences in environment, genetics, or other factors. However, in contrast to the microbiota of the human and rodent vaginal tracts, no culture-based analysis of the baboon microbiota had ever been done previously.
Читать дальшеИнтервал:
Закладка:
Похожие книги на «Bacterial Pathogenesis»
Представляем Вашему вниманию похожие книги на «Bacterial Pathogenesis» списком для выбора. Мы отобрали схожую по названию и смыслу литературу в надежде предоставить читателям больше вариантов отыскать новые, интересные, ещё непрочитанные произведения.


Обсуждение, отзывы о книге «Bacterial Pathogenesis» и просто собственные мнения читателей. Оставьте ваши комментарии, напишите, что Вы думаете о произведении, его смысле или главных героях. Укажите что конкретно понравилось, а что нет, и почему Вы так считаете.