Jean-François Sigrist - Numerical Simulation, An Art of Prediction, Volume 2
Здесь есть возможность читать онлайн «Jean-François Sigrist - Numerical Simulation, An Art of Prediction, Volume 2» — ознакомительный отрывок электронной книги совершенно бесплатно, а после прочтения отрывка купить полную версию. В некоторых случаях можно слушать аудио, скачать через торрент в формате fb2 и присутствует краткое содержание. Жанр: unrecognised, на английском языке. Описание произведения, (предисловие) а так же отзывы посетителей доступны на портале библиотеки ЛибКат.

- Название:Numerical Simulation, An Art of Prediction, Volume 2
- Автор:
- Жанр:
- Год:неизвестен
- ISBN:нет данных
- Рейтинг книги:4 / 5. Голосов: 1
-
Избранное:Добавить в избранное
- Отзывы:
-
Ваша оценка:
Numerical Simulation, An Art of Prediction, Volume 2: краткое содержание, описание и аннотация
Предлагаем к чтению аннотацию, описание, краткое содержание или предисловие (зависит от того, что написал сам автор книги «Numerical Simulation, An Art of Prediction, Volume 2»). Если вы не нашли необходимую информацию о книге — напишите в комментариях, мы постараемся отыскать её.
Numerical Simulation, An Art of Prediction, Volume 2 — читать онлайн ознакомительный отрывок
Ниже представлен текст книги, разбитый по страницам. Система сохранения места последней прочитанной страницы, позволяет с удобством читать онлайн бесплатно книгу «Numerical Simulation, An Art of Prediction, Volume 2», без необходимости каждый раз заново искать на чём Вы остановились. Поставьте закладку, и сможете в любой момент перейти на страницу, на которой закончили чтение.
Интервал:
Закладка:
“Atrazine is an herbicide whose marketing and use have been banned in France since September 2002 and June 2003, respectively. However, they are still found in groundwater in some regions today. Our research aims to understand the physico-chemical mechanisms that would explain how the soils exposed to it release it into the water…”.

Figure 1.17. 3D representation of atrazine (source: www.commons.wikimedia.org ). For a color version of this figure, see www.iste.co.uk/sigrist/simulation2.zip
COMMENT ON FIGURE 1.17.– C8H14ClN5 is the raw chemical formula for atrazine, the active ingredient of a pesticide, also listed, according to the International Union of Pure and Applied Chemistry nomenclature, as 2-chloro-4-(ethylamine)-6-(isopropylamine)-s-thiazine. The figure represents a 3D view of the molecule and highlights the atomic bonds between hydrogen (H, in white), carbon (C, in black), nitrogen (N, in blue) and chlorine (Cl, in green). Atrazine is a powerful herbicide that has long been appreciated by some farmers because it is inexpensive and quite powerful. It was banned in France in 2003 and in the European Union because of its adverse effects on health and the environment, but is still used today in some countries, such as the United States .
It is at the atomic scale that scientists are trying to understand the desorption phenomena – the mechanism by which molecules adsorbed on a substrate detach themselves from it. The model used is gradually being built to describe soil composition, including water and pesticide.
“We built a model by taking into account the pesticide alone and then the pesticide in interaction with different elements present in the soil, such as sodium Na +and calcium Ca 2+. Then we added clay and finally water. At each step, we were able to observe the differences in interactions and understand the phenomena involved, in particular how the binding sites between the pesticide and the clay involved in absorption or desorption change at the molecular scale”.
Simulations consist of solving the Schrödinger equation ( Chapter 1, Volume 1) and can be used to achieve thermodynamic quantities for the chemical species being modeled. This is one of the most accurate models imaginable for this type of problem – and it is also one of the most time-consuming.
The calculations provide access to two types of information:
– Absorption energies and the position of atoms in the corresponding structures: the lower the total energy of the calculated structure, the more likely it is to exist;
– Changes in the spatial organization of atoms over time, over very short periods of time, in the order of the femtosecond to the nanosecond (10–12 and 10–9 s, respectively), can provide thermodynamic information on the studied system.
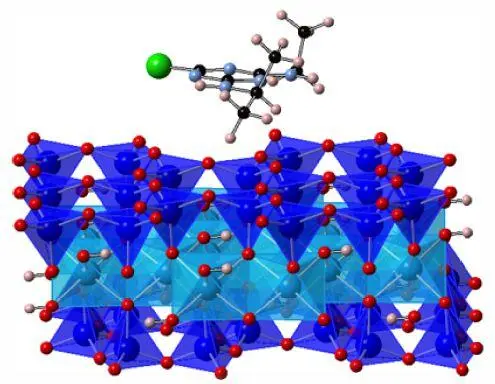
Figure 1.18. Example of calculation at the atomic scale [BEL 17b]. For a color version of this figure, see www.iste.co.uk/sigrist/simulation2.zip
COMMENT ON FIGURE 1.18.– The figure represents a molecular structure calculated for the interaction between atrazine and clay. The soil is modeled here by an infinite crystal lattice: in practice, it is a cell, on the edge of which are applied conditions of repetitiveness, reflecting an infinite extension. The calculation shows how the atrazine molecule behaves in this environment and what the associated energies are. The simulation allows us to find the most probable structures after the adsorption of the pesticide on the clay .
“Due to the complexity and size of the models, we used HPC calculation methods. Simulating the desorption of the pesticide in water requires, for example, nearly two million hours of calculation – spread over the thousands of cores of a supercomputer!”
Calculation at the atomic scale is a first step in research: it serves as a reference for validating models that introduce simplifications and lend themselves to faster calculations. The objective is to carry out simulations under environmental conditions, with the data collected in the fields. Calculations using these models, in which accuracy is demonstrated by comparison with the atomic scale calculation, should determine the pesticide partition constants between the liquid and mineral phases – and answer the initial question. It is a wonderful problem, because it is far from simple!
1.5. Plant growth
Vegetation is one of the crucial resources for humanity, providing it with food and energy – and in some cases a place to live. Satellite observations help to consolidate plant occupancy data on the planet’s surface (Figure 1.19). They enable scientists to understand the influence of natural cycles on vegetation (such as droughts or epidemics) or that of human activities (such as deforestation or CO 2emissions).
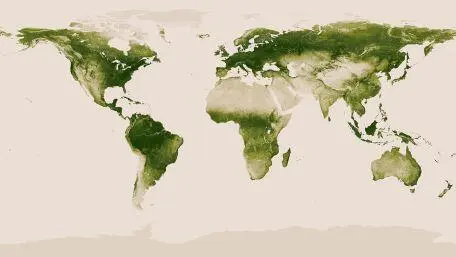
Figure 1.19. Vegetation map obtained from satellite observations (source: NASA/ www.nasa.gouv ). For a color version of this figure, see www.iste.co.uk/sigrist/simulation2.zip
COMMENT ON FIGURE 1.19.– The shades of green on the map correspond to values ranging from 0.0 to 1.0, in arbitrary units. Values close to 1.0 (dark green) indicate the presence of abundant vegetation, as in the Amazon rainforest. Values close to 0.0 (beige) indicate areas with little vegetation, such as the oceans or the Arctic continent. Forests cover 30% of the world’s land area, equivalent to just under 40 million km2, while treeless vegetation (tundra, savannah, temperate grasslands) occupies about the same area .
In 1985, English filmmaker John Boorman recounted in The Esmerald Forest how a world disappears, the world of the Amazon rainforest tribes [BOO 85]. The son of an engineer who oversees the construction of a gigantic dam is taken from his parents by a tribe of Forest Men. As the dam’s construction was completed, the father and son found themselves in circumstances that led them both to confront progress and humanity. The dam will eventually give way under the waters of a river doped by torrential rain, engulfed by the songs of frogs calling on the forces of nature. The engineer who wanted to destroy his work to protect the future of his son and that of a tribe wishing to live in peace will not have this power.
The Amazon rainforest is still one of the largest plant communities on the planet today. According to FAO 2estimates, it is now disappearing at an average rate of 25,000 km 2per year (equivalent to half the size of Austria) to make way for new crops. At this rate, it will have completely disappeared by the first half of the next century. It pays the highest price for the consequences of human activities: more than half of the world’s deforestation. The evolution of vegetation as a whole is of particular concern because of its dual importance: it supports a large part of biodiversity and contributes to the absorption of atmospheric CO 2. Analyzing satellite observation data, NASA researchers show that in just under 20 years, the planet has re-vegetated with an area equivalent to that of the Amazon, with India and China being among the main contributors to this trend. The observed vegetation corresponds, on the one hand, to the growth of new forests, contributing to the sequestration of carbon from the atmosphere, and, on the other hand, to an extension of agricultural areas, whose natural carbon storage balance is generally neutral [CHE 19].
Читать дальшеИнтервал:
Закладка:
Похожие книги на «Numerical Simulation, An Art of Prediction, Volume 2»
Представляем Вашему вниманию похожие книги на «Numerical Simulation, An Art of Prediction, Volume 2» списком для выбора. Мы отобрали схожую по названию и смыслу литературу в надежде предоставить читателям больше вариантов отыскать новые, интересные, ещё непрочитанные произведения.


Обсуждение, отзывы о книге «Numerical Simulation, An Art of Prediction, Volume 2» и просто собственные мнения читателей. Оставьте ваши комментарии, напишите, что Вы думаете о произведении, его смысле или главных героях. Укажите что конкретно понравилось, а что нет, и почему Вы так считаете.