Tarso B. Ledur Kist - Open and Toroidal Electrophoresis
Здесь есть возможность читать онлайн «Tarso B. Ledur Kist - Open and Toroidal Electrophoresis» — ознакомительный отрывок электронной книги совершенно бесплатно, а после прочтения отрывка купить полную версию. В некоторых случаях можно слушать аудио, скачать через торрент в формате fb2 и присутствует краткое содержание. Жанр: unrecognised, на английском языке. Описание произведения, (предисловие) а так же отзывы посетителей доступны на портале библиотеки ЛибКат.

- Название:Open and Toroidal Electrophoresis
- Автор:
- Жанр:
- Год:неизвестен
- ISBN:нет данных
- Рейтинг книги:4 / 5. Голосов: 1
-
Избранное:Добавить в избранное
- Отзывы:
-
Ваша оценка:
Open and Toroidal Electrophoresis: краткое содержание, описание и аннотация
Предлагаем к чтению аннотацию, описание, краткое содержание или предисловие (зависит от того, что написал сам автор книги «Open and Toroidal Electrophoresis»). Если вы не нашли необходимую информацию о книге — напишите в комментариях, мы постараемся отыскать её.
The exact expressions of separation efficiency, resolution, peak capacity, and many other performance indicators of the open and toroidal layouts are presented and compared.
Featuring numerous illustrations throughout,
offers chapters covering: Solvents and Buffer Solutions; Fundamentals of Electrophoresis; Open Layout; and Toroidal Layout. Confronting Performance Indicators is next, followed by chapters on High Voltage Modules and Distributors; Heat Removal and Temperature Control; and Detectors. The book finishes with an examination of the applications of Toroidal Electrophoresis.
The first book to offer a detailed account of Toroidal Electrophoresis—written by one of its creators
Compares the toroidal layouts with the well-established open layouts of the three most used platforms (Capillary, Microchip, and Slab) Provides solutions to many of the experimental issues arising in electromigration techniques and discusses the voltage distributors and detectors that are compatible with the toroidal layouts Richly illustrated with a large number of useful equations showing the relationships between important operational parameters and the performance indicators
is aimed at method developers and separation scientists working in clinical analysis, and food analysis, as well as those in pharmacology, disease biomarker applications, and nucleic acid analysis using the Capillary, Microchip, or slab Platform. It will also benefit undergraduate and graduate students of inorganic analytical chemistry, organic analytical chemistry, bioanalysis, pharmaceutical sciences, clinical sciences, and food analysis.
Open and Toroidal Electrophoresis — читать онлайн ознакомительный отрывок
Ниже представлен текст книги, разбитый по страницам. Система сохранения места последней прочитанной страницы, позволяет с удобством читать онлайн бесплатно книгу «Open and Toroidal Electrophoresis», без необходимости каждый раз заново искать на чём Вы остановились. Поставьте закладку, и сможете в любой момент перейти на страницу, на которой закончили чтение.
Интервал:
Закладка:

Figure 1.4 c–pH diagram of citric acid species in an aqueous solution in the 0 to 14 pH range. 0.1 mol of citric acid was used to prepare 1 L of solution, i.e.  M.
M.
Figures 1.4and 1.5are nothing more than semi-log and log-log plots, respectively. Figure 1.4allows the visualization of concentration changes of the main species at  (3.13),
  (4.76), and
  (6.39). On the other hand, Figure 1.5allows the visualization of the concentrations of extremely diluted species.
1.1.11 Henderson–Hasselbalch Equation
Rearranging the terms on the right hand side of equations 1.14and 1.15, as well as applying the “  ” operator to them, produces the following:
(1.16) 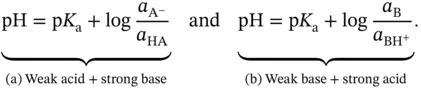
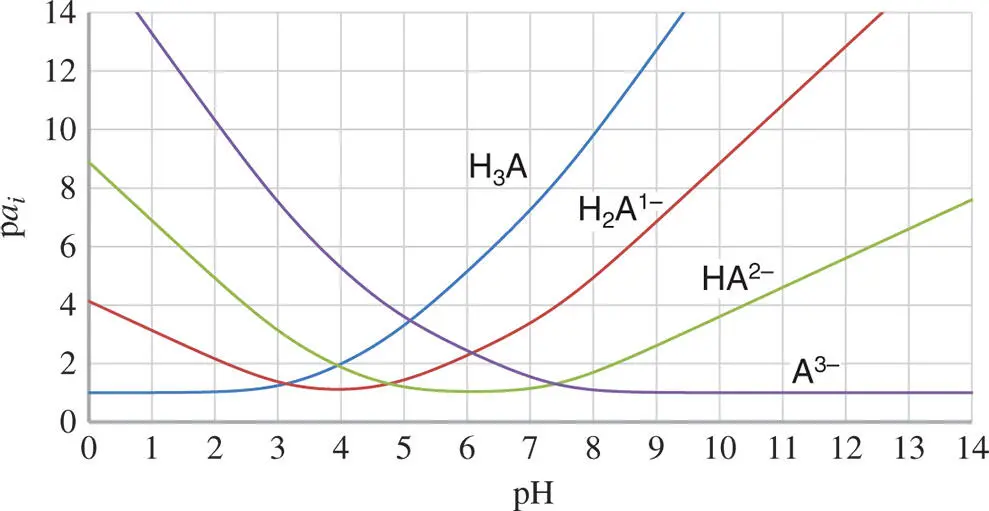
Figure 1.5 p  –pH diagram of citric acid species in an aqueous solution. The conditions are identical to those used in Figure 1.4. Here, however, the concentration of the species can be seen for broader ranges.
Within diluted solutions, the activities  can be replaced by
 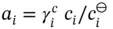 to give
  . Therefore:
(1.17) 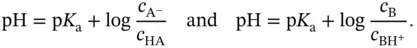
These equations are very useful for the preparation of buffer solutions with a given pH. One way to prepare a buffer solution is by adding a strong base to a solution that contains a weak acid dissolved in it. The concentration of  will be negligible if compared to
  (amount of initial weak acid) before the addition of the strong base. This comes from the definition of a weak acid. Therefore, the addition of
  mol of a strong base to a solution containing
  mol of a weak acid will result in
  mol of A −ions, and
  mol of HA molecules will be left in the solution. The resulting pH will then be given by:
 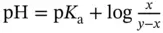 , with the condition that
  . On the other hand, if the weak acid is not so weak (or the weak base is not so weak) then the final pH will be slightly lower (or higher) than predicted. This occurs because extra A −ions, and consequently some H +ions, come from the self-ionization of the acid itself and not just from the added strong base (or strong acid).
Besides precise pHs values, the buffer capacity of a given buffer solution is also a very important parameter as it indicates how good the buffer is at keeping the pH nearly constant throughout the addition of a small quantity of a strong acid or base. Section 1.1.12shows that the highest buffer capacities of monoprotic acids are observed for pH values close to  . The maximum buffer capacity of a multiprotic acid can be visualized by plotting its buffer capacity against pH (also shown in Section 1.1.12). Finally, equation 1.17can be arranged into the more useful format:
(1.18) 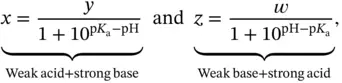
where  are the number of moles of a strong base (strong acid) that must be added to a solution containing
  moles of a weak acid (weak base), characterized by
  , to obtain a final solution with the desired pH. This can then be diluted until the desired concentration is achieved. The ideal situation is to have:
  , as shown in Section 1.1.12.
Equation 1.18will still be valid for multiprotic acids or molecules bearing a mixture of acidic and basic functional groups (zwitterionic compounds or zwitterions) if their  values are separated from each other by at least two units. Examples of such molecules include most proteinogenic amino acids and linear peptides without ionizable lateral chain residues. Within some pH ranges, however, if the
  values are less than two units apart then two or more anions (or cations) from the same acid (or base) will start to coexist at concentration of more than 1% of the total molar concentration of the initial acid (or base). In this case the idea of separately visualizing conjugated acids and bases becomes a little bit confusing as the same species may start to play both roles. This is well demonstrated within the c–p and p–p diagrams. Luckily, buffer capacity (see Section 1.1.12) can still be calculated and measured under these circumstances (
  values, which are less than two units apart from each other).
Интервал:
Закладка:
Похожие книги на «Open and Toroidal Electrophoresis»
Представляем Вашему вниманию похожие книги на «Open and Toroidal Electrophoresis» списком для выбора. Мы отобрали схожую по названию и смыслу литературу в надежде предоставить читателям больше вариантов отыскать новые, интересные, ещё непрочитанные произведения.


Обсуждение, отзывы о книге «Open and Toroidal Electrophoresis» и просто собственные мнения читателей. Оставьте ваши комментарии, напишите, что Вы думаете о произведении, его смысле или главных героях. Укажите что конкретно понравилось, а что нет, и почему Вы так считаете.