Tarso B. Ledur Kist - Open and Toroidal Electrophoresis
Здесь есть возможность читать онлайн «Tarso B. Ledur Kist - Open and Toroidal Electrophoresis» — ознакомительный отрывок электронной книги совершенно бесплатно, а после прочтения отрывка купить полную версию. В некоторых случаях можно слушать аудио, скачать через торрент в формате fb2 и присутствует краткое содержание. Жанр: unrecognised, на английском языке. Описание произведения, (предисловие) а так же отзывы посетителей доступны на портале библиотеки ЛибКат.
- Название:Open and Toroidal Electrophoresis
- Автор:
- Жанр:
- Год:неизвестен
- ISBN:нет данных
- Рейтинг книги:4 / 5. Голосов: 1
-
Избранное:Добавить в избранное
- Отзывы:
-
Ваша оценка:
Open and Toroidal Electrophoresis: краткое содержание, описание и аннотация
Предлагаем к чтению аннотацию, описание, краткое содержание или предисловие (зависит от того, что написал сам автор книги «Open and Toroidal Electrophoresis»). Если вы не нашли необходимую информацию о книге — напишите в комментариях, мы постараемся отыскать её.
The exact expressions of separation efficiency, resolution, peak capacity, and many other performance indicators of the open and toroidal layouts are presented and compared.
Featuring numerous illustrations throughout,
offers chapters covering: Solvents and Buffer Solutions; Fundamentals of Electrophoresis; Open Layout; and Toroidal Layout. Confronting Performance Indicators is next, followed by chapters on High Voltage Modules and Distributors; Heat Removal and Temperature Control; and Detectors. The book finishes with an examination of the applications of Toroidal Electrophoresis.
The first book to offer a detailed account of Toroidal Electrophoresis—written by one of its creators
Compares the toroidal layouts with the well-established open layouts of the three most used platforms (Capillary, Microchip, and Slab) Provides solutions to many of the experimental issues arising in electromigration techniques and discusses the voltage distributors and detectors that are compatible with the toroidal layouts Richly illustrated with a large number of useful equations showing the relationships between important operational parameters and the performance indicators
is aimed at method developers and separation scientists working in clinical analysis, and food analysis, as well as those in pharmacology, disease biomarker applications, and nucleic acid analysis using the Capillary, Microchip, or slab Platform. It will also benefit undergraduate and graduate students of inorganic analytical chemistry, organic analytical chemistry, bioanalysis, pharmaceutical sciences, clinical sciences, and food analysis.
Open and Toroidal Electrophoresis — читать онлайн ознакомительный отрывок
Ниже представлен текст книги, разбитый по страницам. Система сохранения места последней прочитанной страницы, позволяет с удобством читать онлайн бесплатно книгу «Open and Toroidal Electrophoresis», без необходимости каждый раз заново искать на чём Вы остановились. Поставьте закладку, и сможете в любой момент перейти на страницу, на которой закончили чтение.
Интервал:
Закладка:
These allow the content of H 3O +to be known in many more units (including, but not limited to, molar, molal, and g  ) and with much higher precision as more parameters of
  (with
(with  ) become available.[8]
Small molecules carrying an acid and/or a basic group tend to be soluble in pure water and exhibit a certain degree of ionization ( Section 1.1.6) or dissociation ( Section 1.1.5). The ionization or dissociation of the acid HA in aqueous solutions (H 2O + HA ⇌ A −+ H 3O +) at a given temperature is characterized by the acid ionization constants  and
and  . They are defined as:
(1.14) 
where  is the activity of the species
  . The activity of water is approximately constant at a given temperature and with the low solute concentrations normally used in the ESTs. Therefore, it is assumed that
  . Equivalently, the conjugated acid BH +of base B, produced by the equilibrium reaction H 2O + BH + ⇌ B + H 3O +, has the following acid ionization constants:
(1.15) 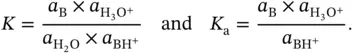
These acid ionization constants are better represented by  , where
  .
.
The  ranges defined for very strong (
  ), strong (
  ), medium, weak, and very weak acids are poorly defined. Nevertheless, it is safe to say that acids with a
  of between 4 and 10 are weak acids and that acids with
  can be considered as very weak acids. The opposite occurs for bases, as for a base to be very strong the
  of the conjugated acid BH +( equation 1.15) must be above 14 (
  ), with strong bases exhibiting
  . Similar to weak acids, weak bases also exhibit
  of between 4 and 10; however, in this case the very weak bases exhibit
  .
.
It is important to note that  significantly changes with temperature for some functional groups:
  , where
  is expected to be a smooth and slowly varying function of temperature. The
  of the great majority of amines decreases with temperature, while carboxylic acids exhibit a much smaller change, usually negative, but there are some exceptions and it depends on the temperature range. These temperature sensitivities have important practical implications for method development within the field of ESTs, as they affect the mobility of the analytes and the pH of the buffers.[9–11] Moreover, they are used to promote cyclic band compression in the toroidal layouts, which is an interesting way to get some control of band spreading along the separation mediums (see Appendix G).
1.1.10 Concentration–pH and pa–pH Diagrams
It is important to know the concentration of all chemical species present in a given buffer solution at a given pH, because some species may interfere with the migrating analytes under study. Additionally, it is also important to know the concentrations of all existing species of an analyte present in a separation medium at a given buffer pH. This is important because the analyte species present define the average electrophoretic mobility of the analyte, the system peaks, and the interactions of the species with the BGE components.  –pH diagrams are one of the most commonly used tools to visualize the concentration of chemical species, showing the concentration of each species at every pH in the
  range (which is the maximum range used in ESTs). Figure 1.4shows the
  –pH diagram of a triprotic acid (0.1 M citric acid in an aqueous solution), which is a complex acid because its successive ionizations produce many species. In Figure 1.4only the most concentrated species can be seen, as the curves of the most diluted species (with
  M) run too close to the line at
  M to be observed. Nevertheless, many detectors (fluorescence and potentiometric) are able to detect species down to
  M and even lower concentrations. Therefore, sometimes it is desirable to visualize the concentration profiles of species within lower concentration ranges. p
  –pH diagrams are ideal for this as they show
  as a function of pH. Figure 1.5shows the same case as studied in Figure 1.4(
  –pH diagram of citric acid at the initial concentration of
  M), but it is now represented as a p
  –pH diagram.
Интервал:
Закладка:
Похожие книги на «Open and Toroidal Electrophoresis»
Представляем Вашему вниманию похожие книги на «Open and Toroidal Electrophoresis» списком для выбора. Мы отобрали схожую по названию и смыслу литературу в надежде предоставить читателям больше вариантов отыскать новые, интересные, ещё непрочитанные произведения.


Обсуждение, отзывы о книге «Open and Toroidal Electrophoresis» и просто собственные мнения читателей. Оставьте ваши комментарии, напишите, что Вы думаете о произведении, его смысле или главных героях. Укажите что конкретно понравилось, а что нет, и почему Вы так считаете.