Bioinformatics
Здесь есть возможность читать онлайн «Bioinformatics» — ознакомительный отрывок электронной книги совершенно бесплатно, а после прочтения отрывка купить полную версию. В некоторых случаях можно слушать аудио, скачать через торрент в формате fb2 и присутствует краткое содержание. Жанр: unrecognised, на английском языке. Описание произведения, (предисловие) а так же отзывы посетителей доступны на портале библиотеки ЛибКат.
- Название:Bioinformatics
- Автор:
- Жанр:
- Год:неизвестен
- ISBN:нет данных
- Рейтинг книги:4 / 5. Голосов: 1
-
Избранное:Добавить в избранное
- Отзывы:
-
Ваша оценка:
Bioinformatics: краткое содержание, описание и аннотация
Предлагаем к чтению аннотацию, описание, краткое содержание или предисловие (зависит от того, что написал сам автор книги «Bioinformatics»). Если вы не нашли необходимую информацию о книге — напишите в комментариях, мы постараемся отыскать её.
“This book is a gem to read and use in practice.”
— "This volume has a distinctive, special value as it offers an unrivalled level of details and unique expert insights from the leading computational biologists, including the very creators of popular bioinformatics tools."
— “A valuable survey of this fascinating field. . . I found it to be the most useful book on bioinformatics that I have seen and recommend it very highly.”
— “This should be on the bookshelf of every molecular biologist.”
— The field of bioinformatics is advancing at a remarkable rate. With the development of new analytical techniques that make use of the latest advances in machine learning and data science, today’s biologists are gaining fantastic new insights into the natural world’s most complex systems. These rapidly progressing innovations can, however, be difficult to keep pace with.
The expanded fourth edition of the best-selling
aims to remedy this by providing students and professionals alike with a comprehensive survey of the current field. Revised to reflect recent advances in computational biology, it offers practical instruction on the gathering, analysis, and interpretation of data, as well as explanations of the most powerful algorithms presently used for biological discovery.
offers the most readable, up-to-date, and thorough introduction to the field for biologists at all levels, covering both key concepts that have stood the test of time and the new and important developments driving this fast-moving discipline forwards.
This new edition features:
New chapters on metabolomics, population genetics, metagenomics and microbial community analysis, and translational bioinformatics A thorough treatment of statistical methods as applied to biological data Special topic boxes and appendices highlighting experimental strategies and advanced concepts Annotated reference lists, comprehensive lists of relevant web resources, and an extensive glossary of commonly used terms in bioinformatics, genomics, and proteomics
is an indispensable companion for researchers, instructors, and students of all levels in molecular biology and computational biology, as well as investigators involved in genomics, clinical research, proteomics, and related fields.
Bioinformatics — читать онлайн ознакомительный отрывок
Ниже представлен текст книги, разбитый по страницам. Система сохранения места последней прочитанной страницы, позволяет с удобством читать онлайн бесплатно книгу «Bioinformatics», без необходимости каждый раз заново искать на чём Вы остановились. Поставьте закладку, и сможете в любой момент перейти на страницу, на которой закончили чтение.
Интервал:
Закладка:
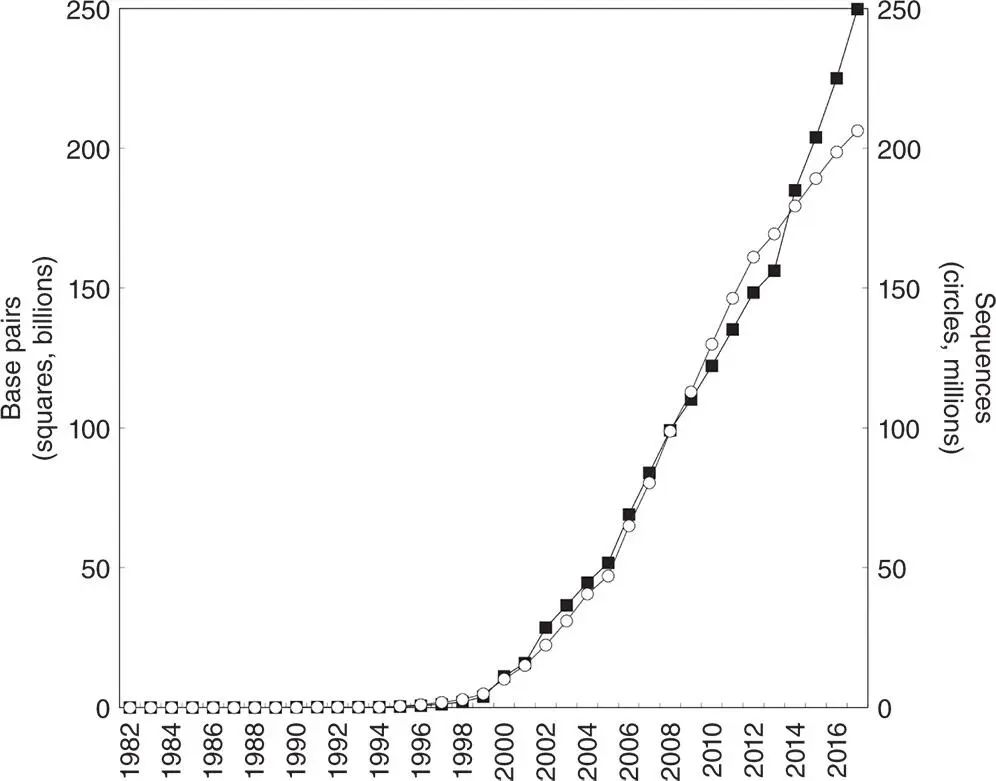
Figure 2.1 The exponential growth of GenBank in terms of number of nucleotides (squares, in millions) and number of sequences submitted (circles, in thousands). Source data for the figure have been obtained from the National Center for Biotechnology Information (NCBI) web site. Note that the period of accelerated growth after 1997 coincides with the completion of the Human Genome Project's genetic and physical mapping goals, setting the stage for high-accuracy, high-throughput sequencing, as well as the development of new sequencing technologies (Collins et al. 1998, 2003; Green et al. 2011).
Integrated Information Retrieval: The Entrez System
One of the most widely used interfaces for the retrieval of information from biological databases is the NCBI Entrez system. Entrez capitalizes on the fact that there are pre-existing, logical relationships between the individual entries found in numerous public databases. For example, a paper in PubMed may describe the sequencing of a gene whose sequence appears in GenBank. The nucleotide sequence, in turn, may code for a protein product whose sequence is stored in NCBI's Protein database. The three-dimensional structure of that protein may be known, and the coordinates for that structure may appear in NCBI's Structure database. Finally, there may be allelic or structural variants documented for the gene of interest, cataloged in databases such as the Single Nucleotide Polymorphism Database (called dbSNP) or the Database of Genomic Structural Variation (called dbVAR), respectively. The existence of such natural connections, all having a biological underpinning, motivated the development of a method through which all of the information about a particular biological entity could be found without having to sequentially visit and query individual databases, one by one.
Entrez, to be clear, is not a database itself. Rather, it is the interface through which its component databases can be accessed and traversed – an integrated information retrieval system. The Entrez information space includes PubMed records, nucleotide and protein sequence data, information on conserved protein domains, three-dimensional structure information, and genomic variation data with potential clinical relevance, a good number of which will be touched upon in this chapter. The strength of Entrez lies in the fact that all of this information, across a large number of component databases, can be accessed by issuing one – and only one – query. This very powerful, integrated approach is made possible through the use of two general types of connections between database entries: neighboring and hard links .
Relationships Between Database Entries: Neighboring
The concept of neighboring enables entries within a given database to be connected to one another. If a user is looking at a particular PubMed entry, the user can then “ask” Entrez to find all of the other papers in PubMed that are similar in subject matter to the original paper. Likewise, if a user is looking at a sequence entry, Entrez can return a list of all other sequences that bear similarity to the original sequence. The establishment of neighboring relationships within a database is based on statistical measures of similarity, some of which are described in more detail below. While the term “neighboring” has traditionally been used to describe these connections, the terminology on the NCBI web site denotes neighbors as “related data.”
BLASTBiological sequence similarities are detected and sequence data are compared with one another using the Basic Local Alignment Search Tool, or BLAST (Altschul et al. 1990). This algorithm attempts to find high-scoring segment pairs – pairs of sequences that can be aligned with one another and, when aligned, meet certain scoring and statistical criteria. Chapter 3discusses the family of BLAST algorithms and their application at length.
VASTMolecular structure similarities are detected and sets of coordinate data are compared using a vector-based method known as VAST (the Vector Alignment Search Tool; Gibrat et al. 1996). This methodology uses geometric criteria to assess similarity between three-dimensional domains, and there are three major steps that take place in the course of a VAST comparison:
First, based on known three-dimensional coordinate data, the alpha helices and beta strands that constitute the structural core of each protein are identified. Straight-line vectors are then calculated based on the position of these secondary structural elements. VAST keeps track of how one vector is connected to the next (that is, how the C-terminal end of one vector connects to the N-terminal end of the next vector), as well as whether each vector represents an alpha helix or a beta strand. Subsequent comparison steps use only these vectors in assessing structural similarity to other proteins – so, in effect, most of the painstakingly deduced atomic coordinate data are discarded at this step. The reason for this apparent oversimplification is simply due to the scale of the problem at hand; with the 150 000 structures in the Molecular Modeling Database (MMDB; Madej et al. 2014) available at the time of this writing, the time that it would take to do an in-depth comparison of each and every one of these structures with all of the other structures in MMDB would make the calculations both impractical and intractable.
Next, the algorithm attempts to optimally align these sets of vectors, looking for pairs of structural elements that are of the same type and relative orientation, with consistent connectivity between the individual elements. The object is to identify highly similar “core substructures,” pairs that represent a statistically significant match above that which would be obtained by comparing randomly chosen proteins with one another.
Finally, a refinement is done using Monte Carlo (random search) methods at each residue position to optimize the structural alignment. The resultant alignment need not be global, as matches may be between individual structural domains of the proteins being compared.
In 2014, a significant improvement to VAST was introduced. This new approach, called VAST+ (Madej et al. 2014), moves beyond assessing structural similarity by comparing individual three-dimensional domains with one another; instead, it considers the entire set of three-dimensional domains within a macromolecular complex. This approach essentially moves the comparison from the tertiary structure to the quaternary structure level, enabling the identification of similar functional, multi-subunit assemblies. In the VAST+ parlance, macromolecular complexes are referred to as a “biological unit” and can include not just the proteins that constitute the complex, but also nucleotides and chemicals where such structural information is available. The VAST+ comparison begins as described above for VAST and then marches through a number of steps that involve the identification of biological units that can be superimposed, calculation of root-mean-square deviations (RMSDs) of the superimposed structures as a quantitative measure of the superposition (see Box 12.1), and, finally, performs a refinement step to improve the RMSD values for the superposition. The result of this process is a global structural alignment where both the most and least similar parts of the aligned molecules can be identified and, from a biological standpoint, comparisons between similarly shaped proteins can be facilitated; it can also be used in the context of looking at conformational changes of a single complex under varying conditions. While VAST+ is now the default method for identifying structural neighbors within the Entrez system, keep in mind that the algorithm depends on biological units being explicitly identified within the source Protein Data Bank (PDB) coordinate data records that form the basis for MMDB records; if no such biological units are defined, the original VAST algorithm is then used for the comparisons.
Читать дальшеИнтервал:
Закладка:
Похожие книги на «Bioinformatics»
Представляем Вашему вниманию похожие книги на «Bioinformatics» списком для выбора. Мы отобрали схожую по названию и смыслу литературу в надежде предоставить читателям больше вариантов отыскать новые, интересные, ещё непрочитанные произведения.


Обсуждение, отзывы о книге «Bioinformatics» и просто собственные мнения читателей. Оставьте ваши комментарии, напишите, что Вы думаете о произведении, его смысле или главных героях. Укажите что конкретно понравилось, а что нет, и почему Вы так считаете.