Beneath are a few sample statements for storing some data into a mat‐file in the current directory and reading the data back from the mat‐file.
>save ABC A B C %store the values of A,B,C into the file 'ABC.mat' >clear A C %clear the memory of MATLAB about A,C >A %what is the value of A? Undefined function or variable 'A' >load ABC A C %read the values of A,C from the file 'ABC.mat' >A % the value of A A= 1 2 3 4 5 6
If you want to store the data into an ASCII dat‐file (in the current directory), make the filename the same as the name of the data and type ‘ ‐ascii’ at the end of the save statement.
>save B.txt B -ascii
However, with the save/load commands into/from a dat‐file, the value of only one variable having the lowercase name can be saved/loaded, a scalar or a vector/matrix. Besides, nonnumeric data cannot be handled by using a dat‐file. If you save a string data into a dat‐file, its ASCII code will be saved. If a dat‐file is constructed to have a data matrix in other environments than MATLAB, every line (row) of the file must have the same number of columns. If you want to read the data from the dat‐file in MATLAB, just type the (lowercase) filename ***.txt after ‘ load’, which will also be recognized as the name of the data contained in the dat‐file.
>load b.txt %read the value of variable b from the ascii file 'b.txt'
At the MATLAB prompt, you can type ‘nm112’ (the filename excluding the extension name part “.m”) and key to run the following M‐file “nm112.m” consisting of several file input(save)/output(load) statements. Then you will see the effects of the individual statements from the running results appearing on the screen.
%nm112.m clear A=[1 2 3;4 5 6] B=[3;-2;1]; C(2)=2; C(4)=4 disp('Press any key to see the input/output through Files') save ABC A B C %save A,B & C as a MAT-file named 'ABC.mat' clear('A','C') %remove the memory about A and C load ABC A C %read MAT-file to recollect the memory about A and C save B.txt B -ascii %save B as an ASCII-file file named 'b.txt' clear B load b.txt %read ASCII-file to recollect the memory about b b x=input('Enter x:') format short e x format rat, x format long, x format short, x
1.1.3 Input/Output of Data Using Keyboard
The command ‘ input ’ enables the user to input some data via the keyboard. For example,
>x=input('Enter x: ') Enter x: 1/3 x= 0.3333
Note that the fraction 1/3 is a nonterminating decimal number, but only four digits after the decimal point is displayed as the result of executing the above command. This is a choice of formatting in MATLAB. One may choose to display more decimal places by using the command ‘ format’, which can make a fraction show up as a fraction, as a decimal number with more digits, or even in an exponential form of a normalized number times 10 to the power of some integer. For instance:
>format rat % as a rational number >x x= 1/3 >format long % as a decimal number with 14 digits >x x= 0.33333333333333 >format long e % as a long exponential form >x x= 3.333333333333333e-001 >format hex % as a hexadecimal form as represented/stored in memory >x x= 3fd5555555555555 >format short e % as a short exponential form >x x= 3.3333e-001 >format short % back to a short form(default) >x x= 0.3333
Note that the number of displayed digits is not the actual number of significant digits of the value stored in computer memory. This point will be made clear in Section 1.2.1.
There are other ways of displaying the value of a variable and a string on the screen than typing the name of the variable. Two useful commands are ‘ disp()’ and ‘ fprintf()’. The former displays the value of a variable or a string without ‘ x=’ or ‘ ans=’; the latter displays the values of several variables in a specified format and with explanatory/cosmetic strings. For example:
>disp('The value of x='), disp(x) The value of x= 0.3333
Table 1.1summarizes the type specifiers and special characters that are used in ‘ fprintf()’ statements.
Table 1.1Conversion type specifiers and special characters used in fprintf() statements.
| Type specifier |
Printing form: fprintf(‘**format string**’,variables_to_be_printed,..) |
Special character |
Meaning |
%c |
character type |
\n |
new line |
%s |
string type |
\t |
tab |
%d |
decimal integer number type |
\b |
backspace |
%f |
floating point number type |
\r |
CR return |
%e |
decimal exponential type |
\f |
form feed |
%x |
hexadecimal integer number |
%% |
% |
%bx |
floating number in 16 hexadecimal digits(64 bits) |
'' |
' |
Beneath is a script named “nm113.m”, which uses the command ‘ input’ so that the user could input some data via the keyboard. If we run the script, it gets a value of the temperature in Fahrenheit (F) via the keyboard from the user, converts it into the temperature in Centigrade (°C) and then prints the results with some remarks both onto the screen and into a data file named ‘nm113.txt’.
%nm113.m f=input('Input the temperature in Fahrenheit[F]:'); c=5/9*(f-32); fprintf('%5.2f(in Fahrenheit) is %5.2f(in Centigrade).\n',f,c) fid=fopen('nm113.txt','w') fprintf(fid,'%5.2f(Fahrenheit) is %5.2f(Centigrade).\n',f,c) fclose(fid)
In case you want the keyboard input to be recognized as a string, you should add the character 's'as the second input argument.
>ans=input('Answer or : ','s')
1.1.4 Two‐Dimensional (2D) Graphic Input/Output
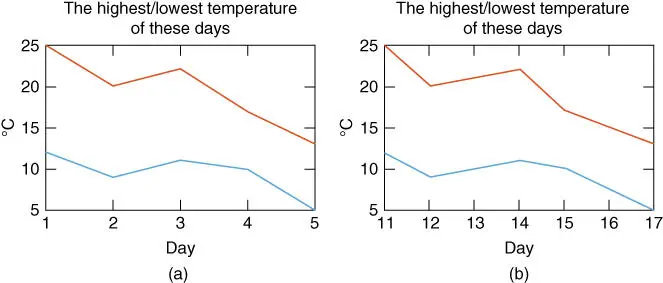
How do we plot the value(s) of a vector or an array? Suppose data reflecting the highest/lowest temperatures for five days are stored as a 5 × 2 array in an ASCII file named ‘temp.txt’.
The job of the MATLAB script “nm01f01.m” is to plot these data. Running the script yields the graph shown in Figure 1.1a. Note that the first two lines are comments about the name and the functional objective of the program (file), and the fifth and sixth lines are auxiliary statements that designate the graph title and units of the vertical/horizontal axis; only the third and fourth lines are indispensable in drawing the colored graph. We need only a few MATLAB statements for this artwork, which shows the power of MATLAB.

Figure 1.1Plot of a 5 × 2 matrix data representing the variations of the highest/lowest temperature. Domain of the horizontal variable unspecified (a) and specified (b).
%nm01f01.m % plot the data of a 5x2 array stored in "temp.txt" load temp.txt % load the data file "temp.txt" clf, plot(temp) % clear any existent figure and plot title('The highest/lowest temperature of these days') ylabel('degrees[C]'), xlabel('day')
Here are several things to keep in mind.
The command ‘ plot()’ reads along the columns of the 5 × 2 array data given as its input argument and recognizes each column as the value of a vector.
MATLAB assumes the domain of the horizontal variable to be [1 2 … 5] by default, where 5 equals the length of the vector to be plotted (see Figure 1.1a).
Читать дальше


