Cecilia Martinez - Improving Health Care Quality
Здесь есть возможность читать онлайн «Cecilia Martinez - Improving Health Care Quality» — ознакомительный отрывок электронной книги совершенно бесплатно, а после прочтения отрывка купить полную версию. В некоторых случаях можно слушать аудио, скачать через торрент в формате fb2 и присутствует краткое содержание. Жанр: unrecognised, на английском языке. Описание произведения, (предисловие) а так же отзывы посетителей доступны на портале библиотеки ЛибКат.
- Название:Improving Health Care Quality
- Автор:
- Жанр:
- Год:неизвестен
- ISBN:нет данных
- Рейтинг книги:3 / 5. Голосов: 1
-
Избранное:Добавить в избранное
- Отзывы:
-
Ваша оценка:
Improving Health Care Quality: краткое содержание, описание и аннотация
Предлагаем к чтению аннотацию, описание, краткое содержание или предисловие (зависит от того, что написал сам автор книги «Improving Health Care Quality»). Если вы не нашли необходимую информацию о книге — напишите в комментариях, мы постараемся отыскать её.
®
® Improving Health Care Quality: Case Studies with JMP
Improving Health Care Quality — читать онлайн ознакомительный отрывок
Ниже представлен текст книги, разбитый по страницам. Система сохранения места последней прочитанной страницы, позволяет с удобством читать онлайн бесплатно книгу «Improving Health Care Quality», без необходимости каждый раз заново искать на чём Вы остановились. Поставьте закладку, и сможете в любой момент перейти на страницу, на которой закончили чтение.
Интервал:
Закладка:
A process variable that is continuous is typically monitored using two charts, one to track the process average and one to track the variation. The I–MR chart combination (in JMP referred to as IR) allows a process to be monitored when there is only one observation per unit time. For example, an emergency department monitoring the number of hours they are not accepting incoming ambulances (ambulance diversion) would employ I‐ and MR‐charts. X‐bar and either an S‐ or R‐chart are applicable when monitoring a process where there are multiple observations per time period, such as the waiting time until a patient completes the intake process in an emergency department. The case “Monitoring Ambulance Diversion Hours” explains the construction and use of I‐ and MR‐control charts. Chapter 11illustrates several types of control charts. Additional information on control charts can be found in Montgomery (2012).
1.5.4 The Importance of Assumptions
Many of the traditional statistical methods, such as hypothesis testing, have assumptions that must be satisfied for the conclusions to be valid. For example, the assumptions underlying the one sample t ‐test are that the data are continuous and follow a Normal distribution and were obtained as a simple random sample. Always check the assumptions underlying a statistical method to avoid drawing an erroneous conclusion. For example, constructing a Normal probability plot or performing a Shapiro–Wilks test verifies normality. The degree to which each method is robust to deviations from the assumptions varies. When assumptions are violated, there are often other methods that can be applied. In the case where the normality assumption does not hold in a one sample t ‐test, the Wilcoxon signed rank test is an alternative. Additional information on dealing with violations of assumptions can be found in Rosner (2015).
1.6 Using this Casebook
This casebook focuses on the use of statistical tools as implemented in JMP for healthcare quality improvement. The cases take a holistic approach to data analysis beginning with background and a specification of the task to be undertaken. The available data is presented and the processing needed to prepare the data for analysis is illustrated. Every analysis begins with descriptive analysis and may be followed by the application of statistical methods, the results of which are interpreted in the case context. Insight and implications from the analysis are then discussed and next actions are suggested. Each case concludes with a table that summarizes the key concepts of statistical analysis, data management, JMP features, and quality tools illustrated. This table is followed by exercises and discussion questions that may be used to master and extend the material presented in the case.
Figure 1.5shows the correspondence between the case structure and the DMAIC and PDCA frameworks. The key concepts are presented at the beginning of each case and associated with the relevant DMAIC and PDCA steps.
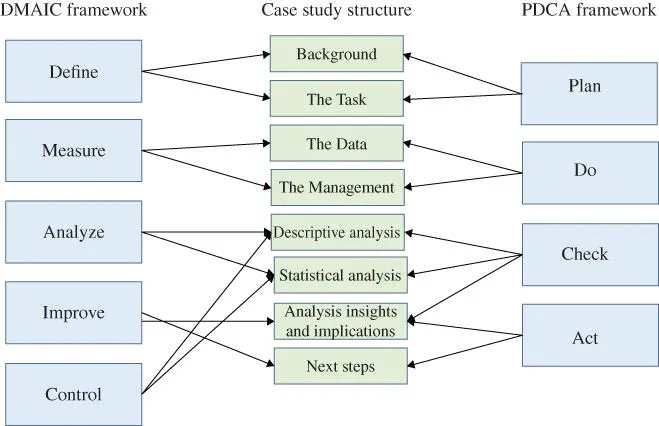
Figure 1.5Case structure and DMAIC and PDCA frameworks.
The 13 cases presented in this book cover the most commonly applied statistical tools in quality improvement and show the step‐by‐step instructions to execute the methods in JMP. The three cases on TJR comprise a complete quality improvement project. Pairs of cases related to a single topic or data set show the application of a sequence of methods, as in the diabetes patient hospitalization data where the first case shows the creation of data visualizations and the second case integrates the data and visualizations in a dashboard ( Chapters 3and 4).
1.7 Summary
Table 1.1summarizes the statistical tools covered in each of the cases.
Table 1.1Summary of statistical tools.
| Chapter | Title | Statistical tools |
| 2 | Improving Patient Satisfaction | Data visualization Descriptive statistics |
| 3 | Length of Stay and Readmission for Hospitalized Diabetes Patients | Data visualization Descriptive statistics |
| 4 | Identify and Communicate Opportunities for Reducing Hospital Length of Stay Using JMP Dashboards | Data visualization Dashboards |
| 5 | Variability in the Cost of Hip Replacement | Data visualization Descriptive statistics Outlier analysis |
| 6 | Benchmarking the Cost of Hip Replacement | Descriptive statistics Data visualization Hypothesis test of mean Confidence interval for mean |
| 7 | Nursing Survey | Data visualization Descriptive statistics Hypothesis test of proportion Hypothesis test for difference between two proportions Confidence interval for proportion |
| 8 | Determining the Sample Size for a Nursing Research Study | Hypothesis testing Sample size determination Power analysis |
| 9 | Mapping California Ambulance Diversion | Descriptive statistics Data visualization Geographic mapping |
| 10 | Monitoring Ambulance Diversion Hours | Descriptive statistics Data visualization IR Control charts |
| 11 | Ambulatory Surgery Start TImes | IR Control charts X‐bar R charts P charts |
| 12 | Pre‐Op TJR Process Improvement – Part 1 | Data visualization Descriptive statistics Time series |
| 13 | Pre‐Op TJR Process Improvement – Part 2 | Data visualization Descriptive statistics Process capability |
| 14 | Pre‐Op TJR Process Improvement – Part 3 | Data visualization Descriptive statistics Hypothesis test on mean difference Confidence interval on mean difference |
1.7.1 Exercises
1 Choose a process that occurs daily in your personal or professional life.Draw a process map that shows the steps.Identify those steps that have controllable or uncontrollable variation.For those steps that are within your control, develop actions that could be taken to improve the process.
2 Consider your travel to work or school. Briefly describe your mode of transportation, route, and duration of the trip. Identify the causes of variability in the time to complete your trip and classify them as either common‐ or special‐cause variation. What actions could you take to reduce your travel time variability?
3 Each US state's health department issues a weekly report during influenza season. Choose a state and select one of the weekly reports during the height of flu season. Evaluate the data visualizations presented in the report. Write a paragraph critiquing the visualizations, commenting on those graphs that were effective and those that were not.
4 Draw a high‐level process map for the steps involved in having a routine blood draw done as part of an annual physical exam. Identify the steps that add value from the patient's perspective and the steps that do not, and the steps that are necessary from the clinical point of view. Identify where in the process interruptions or delays are encountered. Are the causes of delays obvious? Are the bottlenecks that prevent the tasks from flowing continuously easy to identify and eliminate? Use Figure 1.2to identify the process improvement framework that would be appropriate for this case. Justify your answer and identify what kind of data would also be appropriate to collect to narrow scope the project.
1.7.2 Discussion Questions
1 Search the Internet and find a report or journal article that describes a healthcare quality improvement project. Prepare a brief summary of the project and include the following:Describe the process to be improved and the associated problem(s).What quality improvement framework was used?What variables were used to measure the key aspects of the process?What changes were made to the process and who developed these changes?Specifically, how much improvement was realized (e.g. cost savings, amount of risk reduction) and what monitoring was done to assure that the improvement was sustained?
Читать дальшеИнтервал:
Закладка:
Похожие книги на «Improving Health Care Quality»
Представляем Вашему вниманию похожие книги на «Improving Health Care Quality» списком для выбора. Мы отобрали схожую по названию и смыслу литературу в надежде предоставить читателям больше вариантов отыскать новые, интересные, ещё непрочитанные произведения.


Обсуждение, отзывы о книге «Improving Health Care Quality» и просто собственные мнения читателей. Оставьте ваши комментарии, напишите, что Вы думаете о произведении, его смысле или главных героях. Укажите что конкретно понравилось, а что нет, и почему Вы так считаете.