Jane Flint - Principles of Virology
Здесь есть возможность читать онлайн «Jane Flint - Principles of Virology» — ознакомительный отрывок электронной книги совершенно бесплатно, а после прочтения отрывка купить полную версию. В некоторых случаях можно слушать аудио, скачать через торрент в формате fb2 и присутствует краткое содержание. Жанр: unrecognised, на английском языке. Описание произведения, (предисловие) а так же отзывы посетителей доступны на портале библиотеки ЛибКат.
- Название:Principles of Virology
- Автор:
- Жанр:
- Год:неизвестен
- ISBN:нет данных
- Рейтинг книги:3 / 5. Голосов: 1
-
Избранное:Добавить в избранное
- Отзывы:
-
Ваша оценка:
Principles of Virology: краткое содержание, описание и аннотация
Предлагаем к чтению аннотацию, описание, краткое содержание или предисловие (зависит от того, что написал сам автор книги «Principles of Virology»). Если вы не нашли необходимую информацию о книге — напишите в комментариях, мы постараемся отыскать её.
Volume I: Molecular Biology
Volume II: Pathogenesis and Control
Principles of Virology, Fifth Edition
Principles of Virology — читать онлайн ознакомительный отрывок
Ниже представлен текст книги, разбитый по страницам. Система сохранения места последней прочитанной страницы, позволяет с удобством читать онлайн бесплатно книгу «Principles of Virology», без необходимости каждый раз заново искать на чём Вы остановились. Поставьте закладку, и сможете в любой момент перейти на страницу, на которой закончили чтение.
Интервал:
Закладка:
Modern investigations of viral reproduction strategies have their origins in the work of Max Delbrück and colleagues, who studied the T-even bacteriophages starting in 1937. Delbrück believed that these bacteriophages were perfect models for understanding the basis of heredity. He focused his attention on the fact that one bacterial cell usually makes hundreds of progeny virus particles. The yield from one cell is one viral generation; it was called the burstbecause the viruses that he studied literally burst from the infected cell. Under carefully controlled laboratory conditions, most cells make, on average, about the same number of bacteriophages per cell. For example, in one of Delbrück’s experiments, the average number of bacteriophage T4 particles produced from individual single-cell bursts from Escherichia coli cells was 150 particles per cell.
Another important implication of the burst is that a cell has a finite capacity to produce virus. Multiple parameters limit the number of particles produced per cell. These include metabolic resources, the number of sites for genome replication in the cell, the regulation of release of virus particles, and host defenses. In general, larger cells (e.g., eukaryotic cells) produce more virus particles per cell: yields of 1,000 to 10,000 virions per eukaryotic cell are not uncommon.
A burst occurs for viruses that kill the cell after infection, namely, cytopathic viruses. However, some viruses do notkill their host cells, and virus particles are produced as long as the cell is alive. Examples include filamentous bacteriophages, most retroviruses, and hepatitis viruses.
The One-Step Growth Cycle
The idea that one-step growth analysis can be used to study the single-cell reproductive cycle of viruses originated from the work on bacteriophages by Emory Ellis and Delbrück. In their classic experiment, they added virus particles to a culture of rapidly growing E. coli . These particles adsorbed quickly to the cells. The infected culture was then diluted, preventing further adsorption of unbound particles. This simple dilution step is the key to the experiment: it reduces further binding of virus to cells and effectively synchronizes the infection. Samples of the diluted culture were then taken every few minutes and analyzed for the number of infectious bacteriophages.
When the results of this experiment were plotted, several key observations emerged. The graphs were surprising in that they did not resemble the growth curves of bacteria or cultured cells. After a short lag, bacterial cell growth becomes exponential (i.e., each progeny cell is capable of dividing into two cells) and follows a straight line ( Fig. 2.18A). Exponential growth continues until the nutrients in the medium are exhausted. In contrast, numbers of new viruses do not increase in a linear fashion from the start of the infection ( Fig. 2.18B, left). There is an initial lag period in which no infectious viruses can be detected. This lag period is followed by a rapid increase in the number of infectious particles, which then plateaus. The single cycle of virus reproduction produces this “burst” of virus progeny. If the experiment is repeated, such that only a few cells are initially infected, the graph looks different ( Fig. 2.18B, right). Instead of a single cycle, there is a stepwise increase in numbers of new viruses with time. Each step represents one cycle of virus infection.
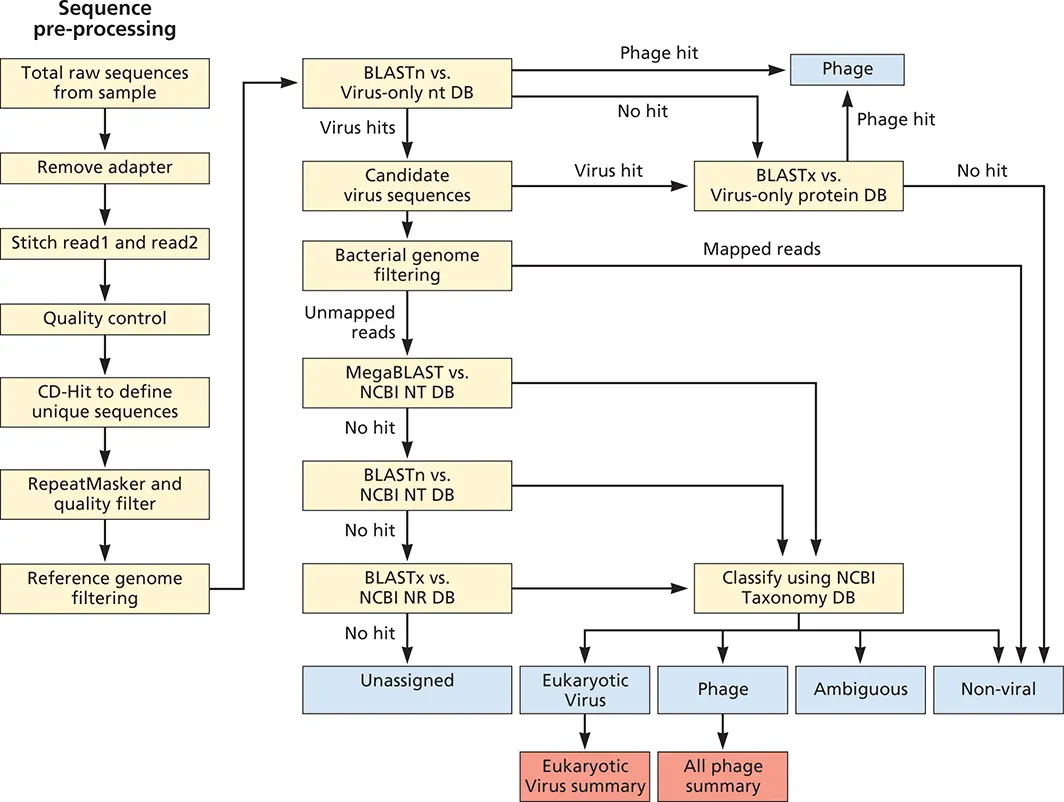
Figure 2.17 Workflow for VS-Virome. Shown is the computational pipeline designed for defining the type and abundance of known and novel viral sequences in metagenomic data sets. VS-Virome first pre-processes the sequences (left) to remove adapter sequences (these are added to every DNA in the sample, and contain barcoding sequences, primer binding sites, and sequences for immobilizing the DNA), joins paired end reads if they overlap, performs quality control on sequences, and identifies low-complexity sequences and host sequences before subjecting all the sequences to BLAST (right) to detect viral sequences. Because integrated prophage are found in bacterial genomes, alignment to comprehensive databases could lead to removal of bona fide bacteriophage sequences. Bacteriophage hits are therefore placed into a separate output file. Candidate eukaryotic viral sequences are filtered to remove sequences that have high identity to bacterial genomes. Remaining reads are then aligned to the more comprehensive GenBank NT and NR databases to identify reads or contigs that have greater similarity to nonviral sequences than to viral sequences (i.e., increased likelihood of being a false positive). To have a high degree of confidence in viral classification, sequences that have significant hits to both viral and any nonviral reference sequence are placed in an “ambiguous” bin. Sequences in the viral bin only have significant alignment to viral sequences.
Once the nature of the viral propagation cycle was explored using the one-step growth curve, questions emerged about what was happening in the cell before the burst. What was the fate of the incoming virus? Did it disappear? How were more virus particles produced? These questions were answered by looking inside the infected cell. Instead of sampling the diluted culture for virus after various periods of infection, researchers prematurely lysed the infected cells as the infection proceeded and then assayed for infectious virus. The results were extremely informative. Immediately after dilution, there was a complete loss, or eclipse, of infectious virus for 10 to 15 min ( Fig. 2.18B). In other words, input virions disappeared, and no new phage particles were produced during this period. It was shown later that the loss of infectivity is a consequence of the release of the genome from the virion, to allow for subsequent transcription of viral genes. Particle infectivity is lost during this phase because the released genome is not infectious under the conditions of the plaque assay. Later, newly assembled infectious particles could be detected inside the cell that had not yet been released by cell lysis.
BOX 2.10
METHODS
How to read a phylogenetic tree
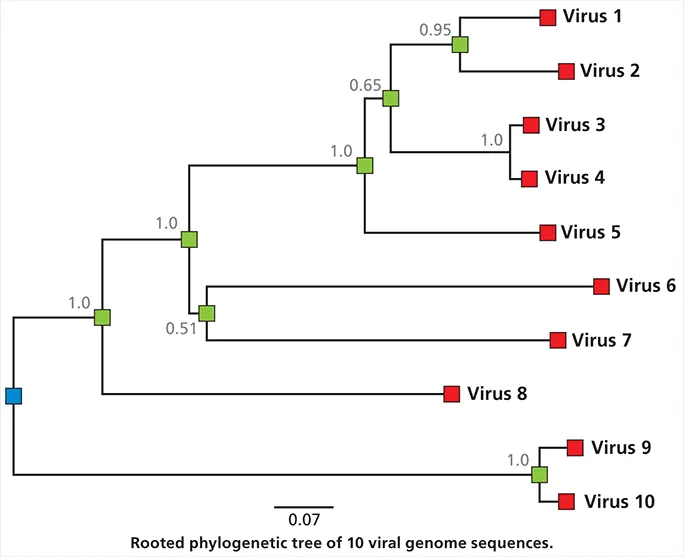
Phylogenetic dendrograms, or trees, provide information about the inferred evolutionary relationships between viruses. The example shown in the figure is a phylogenetic tree for sequenced viral isolates from 10 different individuals. The horizontal dimension of the tree represents the degree of genetic change, and the scale (0.07) is the number of changes divided by the length of the sequence (in some trees this may be expressed as % change). The blue circles, called nodes, represent putative ancestors of the sampled viruses. Therefore, the branches represent chains of infections that have led to sampled viruses. The vertical distances have no significance.
The tree in the figure is rooted , which means that the root of the tree represents the common ancestor of all the sampled viruses. As we move from the root to the tips, we are moving forward in time, although the unit of time might not be known. The numbers next to each node represent the measure of support; these are computed by a variety of statistical approaches including “bootstrapping” and “Bayesian posterior probabilities.” A value close to 1 indicates strong evidence that sequences to the right of the node cluster together better than any other sequences. Often there is no known isolate corresponding to the root of the tree; in this case, an arbitrary root may be estimated, or the tree will be unrooted. In these cases, it can no longer be assumed that the order of ancestors proceeds from left to right.
Читать дальшеИнтервал:
Закладка:
Похожие книги на «Principles of Virology»
Представляем Вашему вниманию похожие книги на «Principles of Virology» списком для выбора. Мы отобрали схожую по названию и смыслу литературу в надежде предоставить читателям больше вариантов отыскать новые, интересные, ещё непрочитанные произведения.


Обсуждение, отзывы о книге «Principles of Virology» и просто собственные мнения читателей. Оставьте ваши комментарии, напишите, что Вы думаете о произведении, его смысле или главных героях. Укажите что конкретно понравилось, а что нет, и почему Вы так считаете.