A. Gouveia Oliveira - Biostatistics Decoded
Здесь есть возможность читать онлайн «A. Gouveia Oliveira - Biostatistics Decoded» — ознакомительный отрывок электронной книги совершенно бесплатно, а после прочтения отрывка купить полную версию. В некоторых случаях можно слушать аудио, скачать через торрент в формате fb2 и присутствует краткое содержание. Жанр: unrecognised, на английском языке. Описание произведения, (предисловие) а так же отзывы посетителей доступны на портале библиотеки ЛибКат.

- Название:Biostatistics Decoded
- Автор:
- Жанр:
- Год:неизвестен
- ISBN:нет данных
- Рейтинг книги:3 / 5. Голосов: 1
-
Избранное:Добавить в избранное
- Отзывы:
-
Ваша оценка:
Biostatistics Decoded: краткое содержание, описание и аннотация
Предлагаем к чтению аннотацию, описание, краткое содержание или предисловие (зависит от того, что написал сам автор книги «Biostatistics Decoded»). Если вы не нашли необходимую информацию о книге — напишите в комментариях, мы постараемся отыскать её.
Extensive coverage of the design and analysis of experiments for basic science research Experimental designs are presented together with the statistical methods The rationale of all forms of ANOVA is explained with simple mathematics A comprehensive presentation of statistical tests for multiple comparisons Calculations for all statistical methods are illustrated with examples and explained step-by-step. This book presents biostatistical concepts and methods in a way that is accessible to anyone, regardless of his or her knowledge of mathematics. The topics selected for this book cover will meet the needs of clinical professionals to readers in basic science research.
Biostatistics Decoded — читать онлайн ознакомительный отрывок
Ниже представлен текст книги, разбитый по страницам. Система сохранения места последней прочитанной страницы, позволяет с удобством читать онлайн бесплатно книгу «Biostatistics Decoded», без необходимости каждый раз заново искать на чём Вы остановились. Поставьте закладку, и сможете в любой момент перейти на страницу, на которой закончили чтение.
Интервал:
Закладка:
As a measure of central tendency, however, the mean is adequate only when the values are symmetrically distributed about its value. This is not the case with a number of attributes we study in biology and medicine – they often have a large number of small values and few very large values. In this case, the mean may not be a good measure of central tendency, because it will indicate the expected value of an attribute. A better measure of central tendency is, in these cases, the median.
The medianis the quantity that divides the sample into two groups with an equal number of observations: one group has all the values smaller than that quantity, and the other group has all the values greater than that quantity. The median, therefore, is a quantity that has a straightforward interpretation: half the observations are smaller than that quantity. Actually, the interpretation of the median is exactly the same as the mean when the values are symmetrically distributed about the mean and, in this case, the mean and median will have the same value. With asymmetric distributions, however, the median will be smaller than the mean.
Figure 1.4presents a plot of the length of stay in days in an intensive care unit. The distribution of values is very asymmetrical, or skewedto the left. In a distribution like that, the median normally reflects better than the mean the expected value of the attribute. Suppose one wanted to predict the length of stay of someone just admitted to intensive care: a guess of 13 days (the median) would be more likely to be close to the actual length of stay than 23 days (the mean).
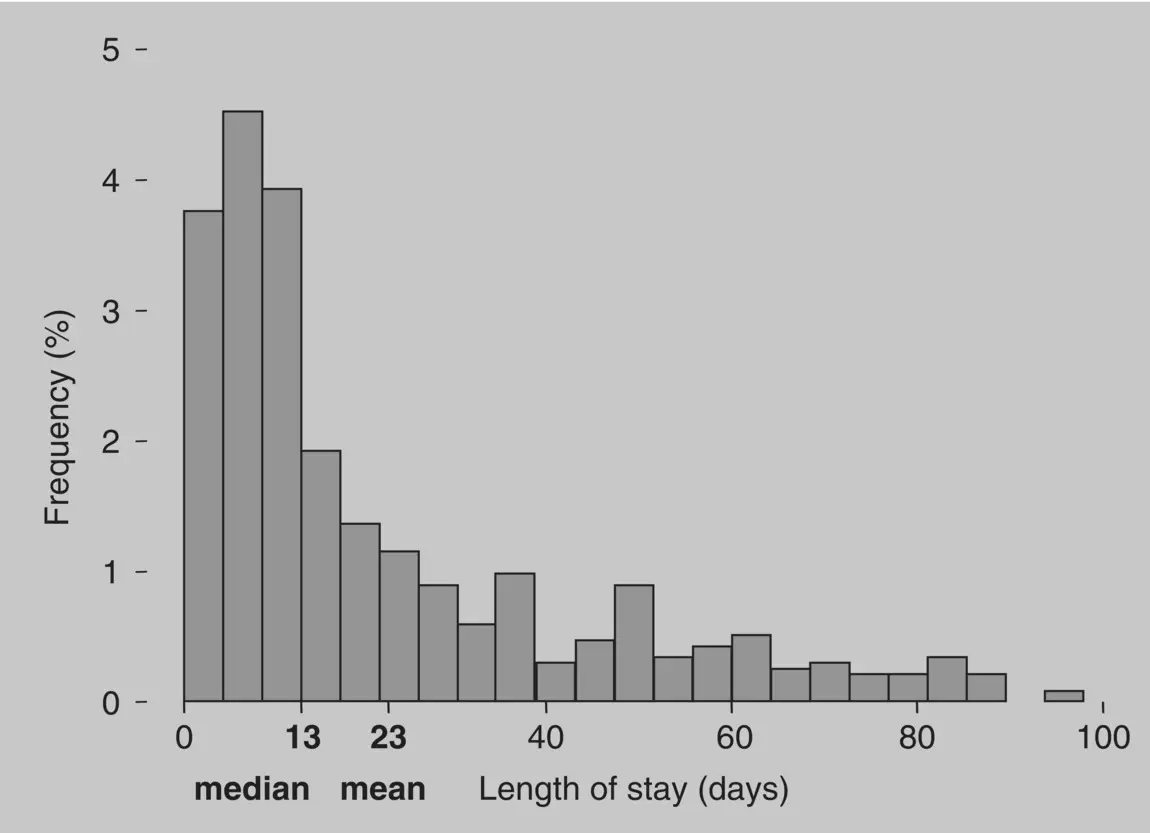
Figure 1.4 Comparison of the mean and the median in an asymmetrical distribution.
One problem with the median is that it is not a mathematical result. To obtain the median, first we must count the number of observations, as we do to compute the mean. Then we must sort all the values in ascending order, divide the number of observations by 2, and round the result to the nearest integer. Then we take this result, go to the observation that occupies that position in the sorted order, and obtain the value of that observation. The value is the median value. Further, if the number of observations is even, then we must take the value of the observation that has a rank in the sorted order equal to the division of the number of observations by 2, then add that value to the value of the next observation in the sorted order, and divide the result by 2 to finally obtain the median value.
The median, therefore, requires an algorithm for its computation. This makes it much less amenable to mathematical treatment than the mean and, consequently, less useful. In many situations, however, the median is a much better measure of central tendency than the mean. For example, attributes that are measured on ordinal scales – recall that with ordinal scales sums and differences are meaningless – should almost always be summarized by the median, not the mean. One possible exception to this rule is when an ordinal scale has so many distinct values, say, more than 50, that we can assume that we are measuring a continuous attribute with a somewhat faulty instrument in which the measurement error varies slightly across the range of values, as if we were measuring lengths with a metric tape in which the marks were erased in some sections so we have to take an approximate reading in those sections. In such a case, it would appear that the attribute had been measured in an ordinal scale while it has actually been measured in an interval scale. This is why we often see data obtained with some clinical questionnaires presented and analyzed as if it were interval data.
The last central tendency measure is the mode. The mode is simply the most common value of an attribute. It has the advantage over the other measures of central tendency that it can be used with all types of scales of measurement, including categorical scales. The mode, however, has many disadvantages and this is why it is seldom used in clinical research. One important problem with the mode is that there is no guarantee that it is a unique value. The most frequent values of an attribute may occur with the same frequency, and then we will have several modes. In addition, in very small samples, each value may occur only once and we will have as many modes as values. No further mention will be made of the mode throughout this book.
So far, we have been considering attributes measured in interval or ordinal scales. However, we are often interested in attributes that may be characterized only by their presence or absence (e.g. family history of asthma) or that classify subjects into two groups (e.g. males and females, death and survival).
As we saw in Section 1.2, attributes taking only two values are called binary attributes. They represent the most elementary type of measurement and, therefore, convey the smallest amount of information. It is useful to think of binary attributes as attributes that may be on or off, because then the above distinction is not necessary. For example, we may think of the “sex” attribute simply as “male sex,” and of its values as yes and no. Similarly, the outcome could be thought of as only “survival,” with values yes and no. This is the same as for the family history of asthma, which also has the values yes and no.
We could convey the same information as yes/no by using the numerical system. Therefore, we could give the attribute the value 1 to mean that it was present, and 0 to mean that it was absent. This is much more appropriate, because now we can think of binary variables not as categories, but as numerical variables that happen to take only two possible values, 0 and 1.
Furthermore, observations from binary variables are commonly presented as relative frequenciesas in, for example, 37% of females or 14% with family history of asthma. If we adopt the 0/1 values for binary variables, those proportions are nothing more than the means of a variable with values 0 and 1. If males have value 0 and females 1, then in a sample of 200 subjects with 74 females the sum of the attribute sex totals 74 which, divided by 200 (the sample size), gives the result 0.37, or 37%.
1.4 Sampling
Sampling is such a central issue in biostatistics that an entire chapter of this book is devoted to discussing it. This is necessary for two main reasons: first, because an understanding of the statistical methods requires a clear understanding of the sampling phenomena; second, because most people do not understand at all the purpose of sampling.
Sampling is a relatively recent addition to statistics. For almost two centuries, statistical science was concerned only with census, the study of entire populations. Nearly a century ago, however, people realized that populations could be studied easier, faster, and more economically if observations were used from only a small part of the population, a sample of the population, instead of the whole population. The basic idea was that, provided a sufficient number of observations were made, the patterns of interest in the population would be reproduced in the sample. The measurements made in the sample would then mirror the measurements in the population.
This approach to sampling had, as a primary objective, to obtain a miniature version of the population. The assumption was that the observations made in the sample would reflect the structure of the population. This is very much like going to a store and asking for a sample taken at random from a piece of cloth. Later, by inspecting the sample, one would remember what the whole piece was like. By looking at the colors and patterns of the sample, one would know what the colors and patterns were in the whole piece ( Figure 1.5).
Читать дальшеИнтервал:
Закладка:
Похожие книги на «Biostatistics Decoded»
Представляем Вашему вниманию похожие книги на «Biostatistics Decoded» списком для выбора. Мы отобрали схожую по названию и смыслу литературу в надежде предоставить читателям больше вариантов отыскать новые, интересные, ещё непрочитанные произведения.


Обсуждение, отзывы о книге «Biostatistics Decoded» и просто собственные мнения читателей. Оставьте ваши комментарии, напишите, что Вы думаете о произведении, его смысле или главных героях. Укажите что конкретно понравилось, а что нет, и почему Вы так считаете.