George Acquaah - Principles of Plant Genetics and Breeding
Здесь есть возможность читать онлайн «George Acquaah - Principles of Plant Genetics and Breeding» — ознакомительный отрывок электронной книги совершенно бесплатно, а после прочтения отрывка купить полную версию. В некоторых случаях можно слушать аудио, скачать через торрент в формате fb2 и присутствует краткое содержание. Жанр: unrecognised, на английском языке. Описание произведения, (предисловие) а так же отзывы посетителей доступны на портале библиотеки ЛибКат.
- Название:Principles of Plant Genetics and Breeding
- Автор:
- Жанр:
- Год:неизвестен
- ISBN:нет данных
- Рейтинг книги:5 / 5. Голосов: 1
-
Избранное:Добавить в избранное
- Отзывы:
-
Ваша оценка:
Principles of Plant Genetics and Breeding: краткое содержание, описание и аннотация
Предлагаем к чтению аннотацию, описание, краткое содержание или предисловие (зависит от того, что написал сам автор книги «Principles of Plant Genetics and Breeding»). Если вы не нашли необходимую информацию о книге — напишите в комментариях, мы постараемся отыскать её.
Organizes topics to reflect the stages of an actual breeding project Incorporates the most recent technologies in the field, such as CRSPR genome edition and grafting on GM stock Includes numerous illustrations and end-of-chapter self-assessment questions, key references, suggested readings, and links to relevant websites Features a companion website containing additional artwork and instructor resources
offers researchers and professionals an invaluable resource and remains the ideal textbook for advanced undergraduates and graduates in plant science, particularly those studying plant breeding, biotechnology, and genetics.
Principles of Plant Genetics and Breeding — читать онлайн ознакомительный отрывок
Ниже представлен текст книги, разбитый по страницам. Система сохранения места последней прочитанной страницы, позволяет с удобством читать онлайн бесплатно книгу «Principles of Plant Genetics and Breeding», без необходимости каждый раз заново искать на чём Вы остановились. Поставьте закладку, и сможете в любой момент перейти на страницу, на которой закончили чтение.
Интервал:
Закладка:
4.2 Quantitative traits
Most traits encountered in plant breeding are quantitatively inherited. Many genes control such traits, each contributing a small effect to the overall phenotypic expression of a trait. Variation in quantitative trait expression is without natural discontinuities (i.e. the variation is continuous). The traits that exhibit continuous variations are also called metric traits. Any attempt to classify such traits into distinct groups is only arbitrary. For example, height is a quantitative trait. If plants are grouped into tall versus short plants, one could find relatively tall plants in the short group and similarly short plants in the tall group.
4.2.1 Qualitative genetics versus quantitative genetics
The major way in which qualitative genetics and quantitative genetics differ may be summarized as follows:
Nature of traitsQualitative genetics is concerned with traits that have Mendelian inheritance and can be described according to kind, and as previously discussed, can be unambiguously categorized. Quantitative genetic traits are described in terms of the degree of expression of the trait, rather than the kind.
Scale of variabilityQualitative genetic traits provide discrete (discontinuous) phenotypic variation, whereas quantitative genetic traits produce phenotypic variation that spans the full spectrum (continuous).
Number of genesIn qualitative genetics, the effects of single genes are readily detectable, while in quantitative genetics, single gene effects are not discernible. Rather, traits are under polygenic control (genes with small indistinguishable effects).
Mating patternQualitative genetics is concerned with individual matings and their progenies. Quantitative genetics is concerned with a population of individuals that may comprise a diversity of mating kinds.
Statistical analysisQualitative genetic analysis is quite straightforward, and is based on counts and ratios. On the other hand, quantitative analysis provides estimates of population parameters (attributes of the population from which the sample was obtained).
4.2.2 The environment and quantitative variation
All genes are expressed in an environment (phenotype = genotype + environmental effect). However, quantitative traits tend to be influenced to a greater degree than qualitative traits. Under significantly large environmental effects, qualitative traits (controlled by one or a few major genes) can exhibit quantitative trait inheritance pattern. A strong environmental influence causes the otherwise distinct classes to overlap ( Figure 4.1).
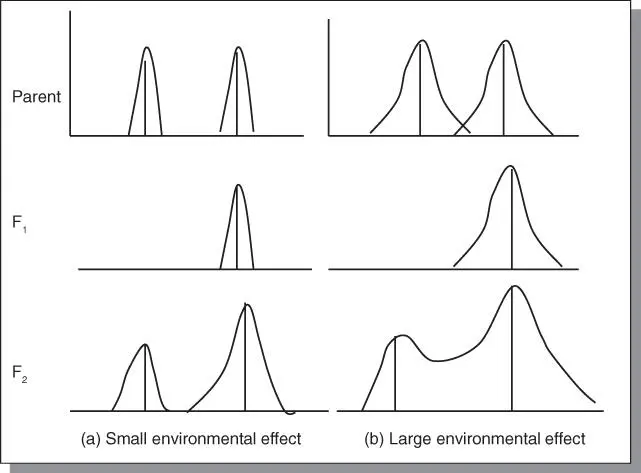
Figure 4.1Environmental effect on gene expression. The phenotype = genotype + environment. Some traits are influenced a lot more than others by the environment. Cross (a) has small environmental influence such that the phenotypes are distinguishable in the F 2; in cross (b) the environmental influence is strong, resulting in more blurring of the differences among phenotypes in the segregating population.
4.2.3 Polygenes and polygenic inheritance
Quantitative traits are controlled by multiple genes or polygenes.
What are polygenes?
Polygenesare genes with effects that are too small to be individually distinguished. They are sometimes called minor genes. In polygenic inheritance, segregation occurs at a large number of loci affecting a trait. The phenotypic expression of polygenic traits is susceptible to significant modification by the variation in environmental factors to which plants in the population are subjected. Polygenic variation cannot be classified into discrete groups (i.e. variation is continuous). This is because of the large number of segregating loci, each with effects so small that it is not possible to identify individual gene effects in the segregating population or meaningfully describe individual genotypes. Instead, biometrics is used to describe the population in terms of means and variances. Continuous variation is caused by environmental variation and genetic variation due to the simultaneous segregation of many genes affecting the trait. These effects convert the intrinsically discrete variation to a continuous one. Biometrical genetics is used to distinguish between the two factors that cause continuous variability to occur.
Another aspect of polygenic inheritance is that different combinations of polygenes can produce a particular phenotypic expression. Furthermore, it is difficult to measure the role of environment on trait expression because it is very difficult to measure the environmental effect on a plant basis. Consequently, a breeder attempting to breed a polygenic trait should evaluate the cultivar in an environment that is similar to that prevailing in the production region. It is beneficial to plant breeding if a tight linkage of polygenes (called polygenic block; linkage block) that has favorable effects on traits of interest to the breeder is discovered.
In 1910, a Swedish geneticist, Nilsson‐Ehle provided a classic demonstration of polygenic inheritance and in the process helped to bridge the gap between our understanding of the essence of quantitative and qualitative traits. Polygenic inheritance may be explained by making three basic assumptions:
1 That many genes determine the quantitative trait.
2 These genes lack dominance.
3 The action of the genes is additive.
Nilsson‐Ehle crossed two varieties of wheat, one with deep red grain of genotype R 1 R 1 R 2 R 2, and the other white grain of genotype r 1r 1r 2r 2. The results are summarized in Table 4.1. He observed that all the seed of the F 1was medium red. The F 2showed about 1/16 dark red and 1/16 white seed, the remainder being intermediate. The intermediates could be classified into 6/16 medium red (like the F 1), 4/16 red, and 4/16 light red. The F 2distribution of phenotypes may be obtained as an expansion of the binomial (a + b) 4, where a = b = ½ (a binomial coefficient is the number of combinations of r items that can be selected from a set of n items).
Table 4.1Transgressive segregation.
| P 1 | 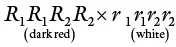 |
| F 1 | R 1 r 1 R 2 r 2 |
| F 2 | 1/16 = R 1 R 1 R 2 R 2 |
| 4/16 = R 1 R 1 R 2 r 2, R 1 r 1 R 2 R 2 | |
| 6/16 = R 1 R 1 r 2 r 2, R 1 r 1 R 2 r 2, r 1 r 1 R 2 R 2 | |
| 4/6 = R 1 r 1 r 2 r 2, r 1 r 1 R 2 r 2 | |
| 1/16 = r 1 r 1 r 2 r 2 |
His interpretation was that the two genes each had a pair of alleles that exhibited cumulative effects. In other words, the genes lacked dominance and their action was additive. Each allele R 1or R 2added some red to the phenotype so that the genotypes of white contained neither of these alleles, while the dark red genotype contained only R 1and R 2. The phenotypic frequency ratio resulting from the F 2was 1 : 4 : 6 : 4 : 1 (i.e. nine genotypes and five classes) ( Figure 4.2).
Читать дальшеИнтервал:
Закладка:
Похожие книги на «Principles of Plant Genetics and Breeding»
Представляем Вашему вниманию похожие книги на «Principles of Plant Genetics and Breeding» списком для выбора. Мы отобрали схожую по названию и смыслу литературу в надежде предоставить читателям больше вариантов отыскать новые, интересные, ещё непрочитанные произведения.


Обсуждение, отзывы о книге «Principles of Plant Genetics and Breeding» и просто собственные мнения читателей. Оставьте ваши комментарии, напишите, что Вы думаете о произведении, его смысле или главных героях. Укажите что конкретно понравилось, а что нет, и почему Вы так считаете.