Michael Begon - Ecology
Здесь есть возможность читать онлайн «Michael Begon - Ecology» — ознакомительный отрывок электронной книги совершенно бесплатно, а после прочтения отрывка купить полную версию. В некоторых случаях можно слушать аудио, скачать через торрент в формате fb2 и присутствует краткое содержание. Жанр: unrecognised, на английском языке. Описание произведения, (предисловие) а так же отзывы посетителей доступны на портале библиотеки ЛибКат.
- Название:Ecology
- Автор:
- Жанр:
- Год:неизвестен
- ISBN:нет данных
- Рейтинг книги:5 / 5. Голосов: 1
-
Избранное:Добавить в избранное
- Отзывы:
-
Ваша оценка:
Ecology: краткое содержание, описание и аннотация
Предлагаем к чтению аннотацию, описание, краткое содержание или предисловие (зависит от того, что написал сам автор книги «Ecology»). Если вы не нашли необходимую информацию о книге — напишите в комментариях, мы постараемся отыскать её.
– now in full colour – offers students and practitioners a review of the ecological sciences.
The previous editions of this book earned the authors the prestigious ‘Exceptional Life-time Achievement Award’ of the British Ecological Society – the aim for the fifth edition is not only to maintain standards but indeed to enhance its coverage of Ecology.
In the first edition, 34 years ago, it seemed acceptable for ecologists to hold a comfortable, objective, not to say aloof position, from which the ecological communities around us were simply material for which we sought a scientific understanding. Now, we must accept the immediacy of the many environmental problems that threaten us and the responsibility of ecologists to play their full part in addressing these problems. This fifth edition addresses this challenge, with several chapters devoted entirely to applied topics, and examples of how ecological principles have been applied to problems facing us highlighted throughout the remaining nineteen chapters.
Nonetheless, the authors remain wedded to the belief that environmental action can only ever be as sound as the ecological principles on which it is based. Hence, while trying harder than ever to help improve preparedness for addressing the environmental problems of the years ahead, the book remains, in its essence, an exposition of the
of ecology. This new edition incorporates the results from more than a thousand recent studies into a fully up-to-date text.
Written for students of ecology, researchers and practitioners, the fifth edition of
is anessential reference to all aspects of ecology and addresses environmental problems of the future.
Ecology — читать онлайн ознакомительный отрывок
Ниже представлен текст книги, разбитый по страницам. Система сохранения места последней прочитанной страницы, позволяет с удобством читать онлайн бесплатно книгу «Ecology», без необходимости каждый раз заново искать на чём Вы остановились. Поставьте закладку, и сможете в любой момент перейти на страницу, на которой закончили чтение.
Интервал:
Закладка:
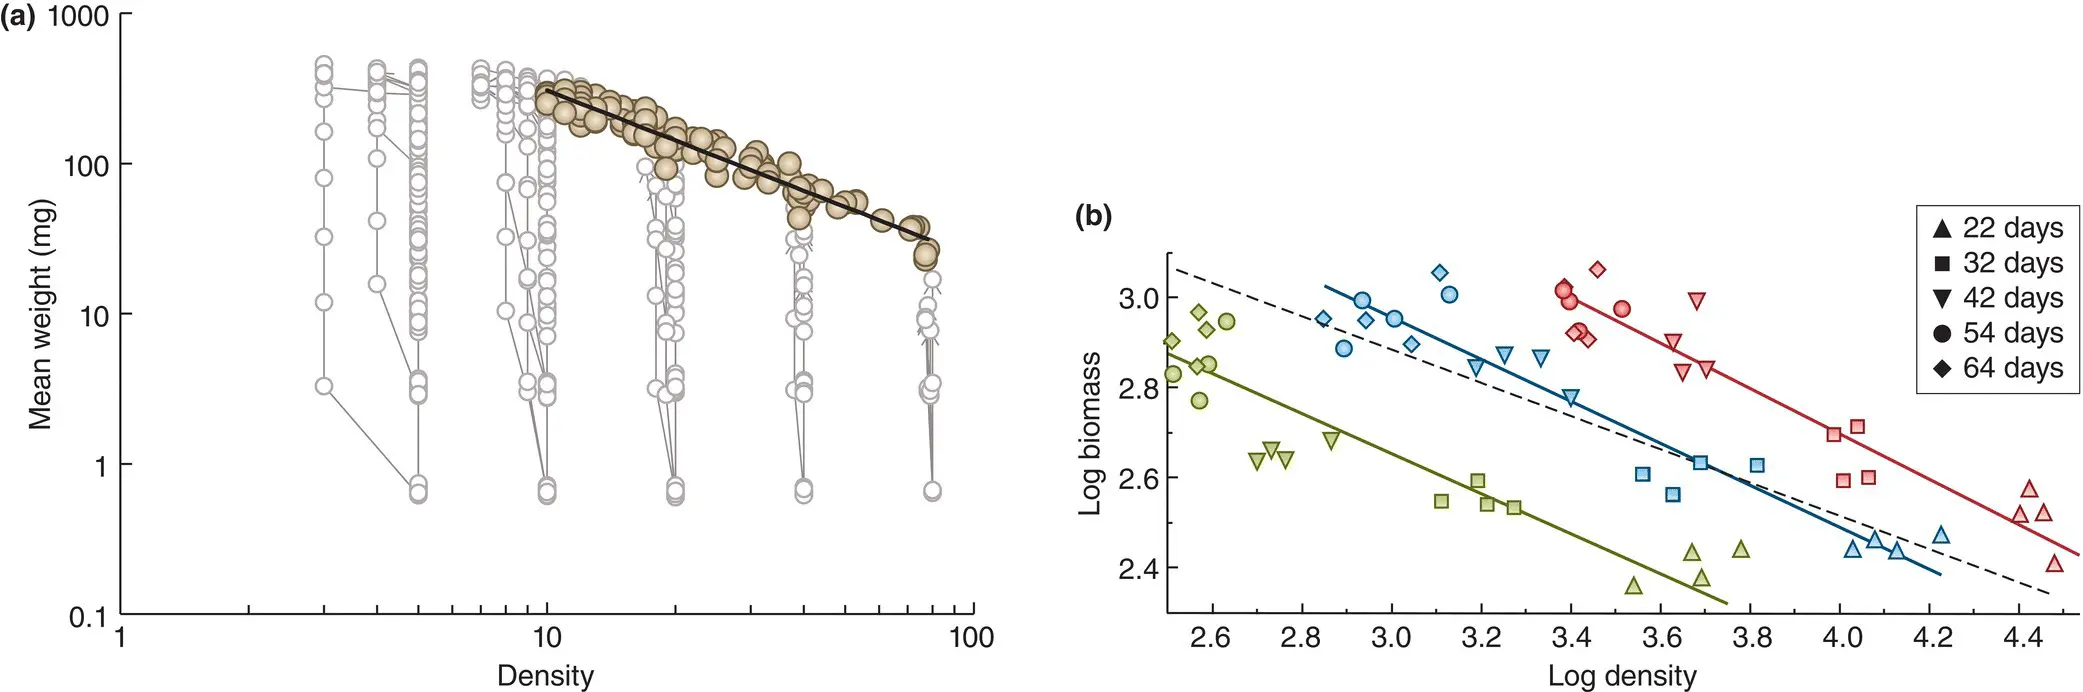
Figure 5.39 Self‐thinning lines vary in their support for the metabolic theory.(a) Self‐thinning in house crickets, Acheta domesticus , plotting mean weight against density on log scales. Replicate populations were established with between five and 80 newly hatched nymphs and followed until all survivors had hatched into adults. Lines join points from the same replicate, with the exception of the regression line fitted to self‐thinning populations from the three highest densities only (slope ± 95% CI, −1.11 ± 0.05). (b) Self‐thinning in common buckwheat, Fagopyrum esculentum , plotting log biomass against log density. Three initial densities, 8000 (green), 24 000 (blue) and 48 000 (red) individuals m –2were harvested after 22, 32, 42, 54 and 64 days. The dashed line is fitted to all data combined (slope, 95% CI: −0.38 (−0.30 to −0.47)), and the solid lines are fitted to the individual initial densities (slopes, 95% CIs: −0.45 (−0.36 to −0.55), −0.47 (−0.40 to −0.55) and −0.50 (−0.43 to −0.59) for 8000, 24 000 and 48 000, respectively).
Source : (a) After Jonsson (2017). (b) After Li et al . (2013).
Moreover, when experimental populations of common buckwheat, Fagopyrum esculentum , were grown at a range of densities, the best estimate for the slope of the biomass–density relationship overall was −0.38 ( Figure 5.39b), very similar to the value of −0.33 predicted by the metabolic theory (and significantly different from −0.5, predicted by the areal argument). But if separate lines were fitted for each of the three initial densities, the slopes were −0.45, −0.47 and 0.50, all consistent with the areal argument and significantly different from −0.33 ( Figure 5.39b). The different intercepts of the three lines (plants sown at higher initial densities had greater biomass) seemed to reflect an effect of initial density on growth form and perhaps on the degree of asymmetry in the competitive process (Li et al ., 2013). This suggests, in turn, that light interception may drive patterns in individual populations while metabolic constraints set limits in a species overall.
What seems clear is that we have moved further from, not closer to, anything that could be called a self‐thinning ‘law’. But this represents progress in the important sense of acknowledging the range of forces acting on growing, competing cohorts of individuals, and recognising, too, that the details of a species’ morphology or physiology may influence the way in which those forces act and the slopes of the resulting relationships. The patterns we observe are likely to be the combined effect of a range of forces, even if in some cases one of those forces may dominate – metabolic constraints in mobile animals, light interception in many plants; light interception in individual populations, metabolic constraints in a species overall. Universal rules have their attractions but Nature is not so easily seduced.
APPLICATION 5.4 Density management diagrams
The precise nature of self‐thinning and species boundary lines, and of the forces shaping them, are important and interesting issues, but from the point of view of managing growing, crowded, single‐species cohorts, those details are arguably less important than a simple recognition of the fundamental patterns that underlie all variants of these lines – that as cohorts grow and compete, there are boundaries in density‐biomass or density‐mean size space beyond which they cannot go, and trajectories that they tend to follow. This underpins, for example, one particular approach to the exploitation of commercially important growing cohorts: the construction and use of density management diagrams (DMDs) (Jack & Long, 1996). We conclude here, therefore, by looking at the use of a DMD for Norway spruce, Picea abies , in central‐southern European montane regions ( Figure 5.40), focusing on general principles rather than going into detailed calculations. Data had been compiled from France, Germany, Italy, the Czech Republic, Romania and Bulgaria on the density of trees and their average diameter in a total of 1609 plots, selected as having at least 80% Norway spruce and being markedly ‘even‐aged’ (a strongly unimodal and non‐skewed diameter distribution). These were then used to estimate a species‐boundary – in this case, a linear combination of density and individual size on a log–log plot ( Figure 5.40) that encompasses all but the 2% of plots with the greatest biomass. (Using this rather than the absolute maximum biomass prevents the line being overly influenced by a few rogue populations.) Other analyses of the data were able to estimate the speed and direction with which populations are likely to proceed through this size‐density space.
We can see that the DMD encapsulates what the data can tell us about self‐thinning in Norway spruce. The use of the DMD in managing any particular Norway spruce population (or type of population) then proceeds as follows: (1) the starting position of the population on the DMD is identified; (2) the target position is also identified, along with the likely trajectory to it in an unmanaged population; (3) the trajectory and time‐scale of an alternative route to the target is estimated, usually based on a managed reduction in density, designed to prevent or delay the onset of competition‐related mortality (Vacchiano et al ., 2013). In this case, examples include managing future timber production (illustrated in Figure 5.40), ensuring mechanical stability against wind damage (where susceptibility is greatest in stands with slender trees that arise when the intensity of competition is high), enhancing the protective powers of stands against avalanches and rockfalls (similar to windfirmness, but with the additional need to avoid gaps between trees that may ‘release’ an avalanche), and minimising vulnerability to spruce bark beetle attack (achieved by delaying canopy closure).
For the timber production in Figure 5.40, the target tree diameter, for commercial purposes, is 40 cm. From an initial population of trees 10 cm in diameter, growing at a density of 2600 trees per hectare, the DMD suggests that unmanaged self‐thinning would take the population to that target diameter in around 90 years with around 650 trees per hectare. An alternative suggested in the figure, however, would be a period of managed thinning, taking the density to around 400 trees per hectare, following which they would grow unaffected by competition‐induced mortality and reach the target diameter in a total of only 70 years. Although the overall harvest would be smaller, getting a commercial return 20 years earlier will often make perfect economic sense. Understanding both the principles and the details of Norway spruce self‐thinning helps the forest managers achieve this.
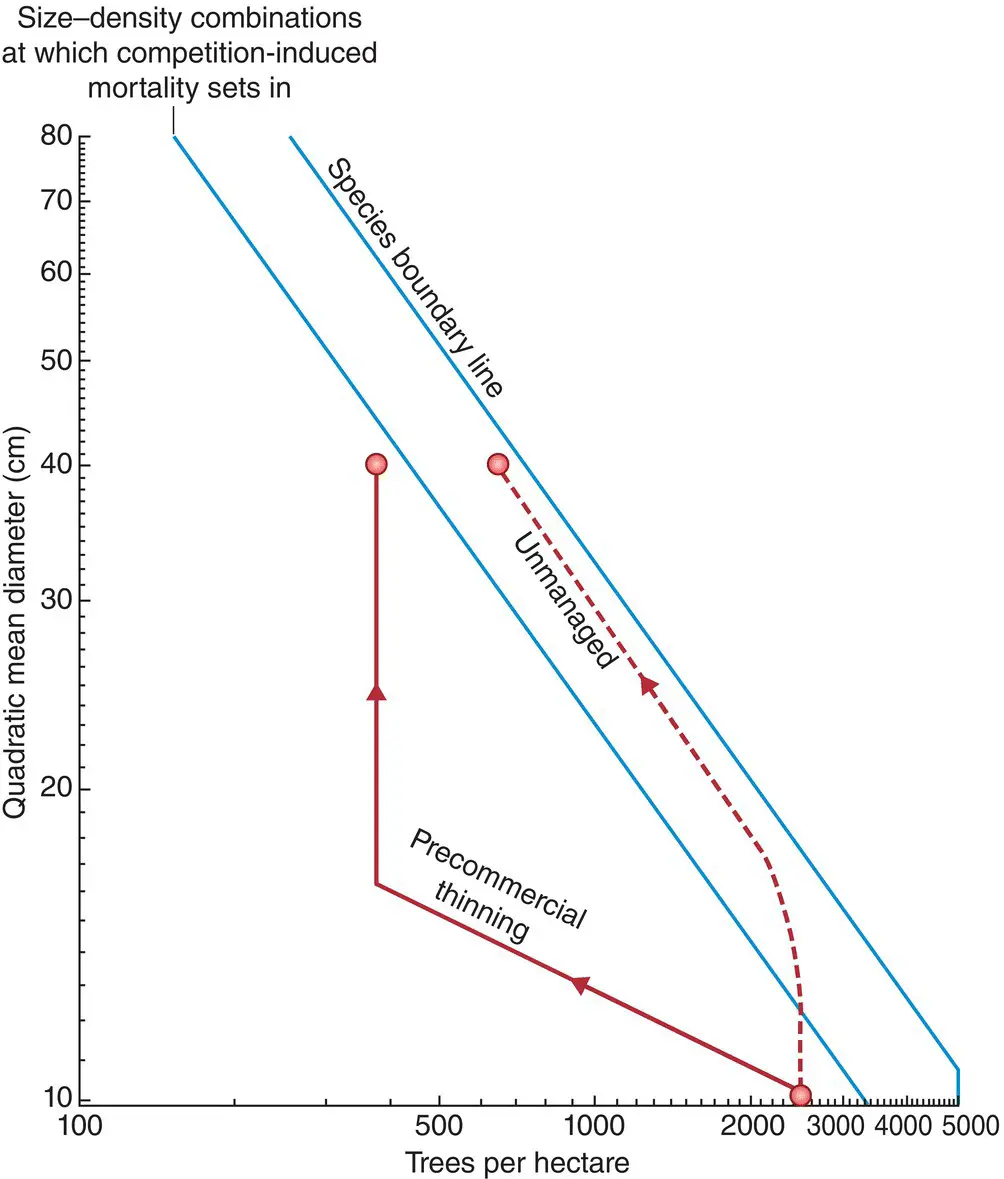
Figure 5.40 A density management diagram (DMD) for Norway spruce in central‐southern European montane regions, based on observed combinations of stand density and average tree size (calculated as the quadratic mean diameter – the square root of the mean of the squared diameters), both plotted on log scales. Alternative trajectories over time are plotted from an initial population of 2600 10 cm diameter trees per hectare (bottom right, red circle). Unmanaged self‐thinning would give rise to a population of c . 650 40 cm diameter trees per hectare in 90 years. Managed precommercial thinning would give rise to a population of c . 400 40 cm diameter trees per hectare in 70 years.
Читать дальшеИнтервал:
Закладка:
Похожие книги на «Ecology»
Представляем Вашему вниманию похожие книги на «Ecology» списком для выбора. Мы отобрали схожую по названию и смыслу литературу в надежде предоставить читателям больше вариантов отыскать новые, интересные, ещё непрочитанные произведения.


Обсуждение, отзывы о книге «Ecology» и просто собственные мнения читателей. Оставьте ваши комментарии, напишите, что Вы думаете о произведении, его смысле или главных героях. Укажите что конкретно понравилось, а что нет, и почему Вы так считаете.