Of course, Figure 5.13c, like the rest of Figure 5.13, is a gross simplification. It assumes, apart from anything else, that changes in population size are affected only by intraspecific competition. Nevertheless, something akin to sigmoidal population growth can be perceived in many natural and experimental situations ( Figure 5.15).

Figure 5.15 Real examples of S‐shaped population increase.(a) The bacterium Lactobacillus sakei (measured as grams of ‘cell dry mass’ or CDM per litre) grown in nutrient broth. (b) The population of shoots of the annual plant Juncus gerardii in a salt marsh habitat on the west coast of France. (c) The population of the willow tree ( Salix cinerea ) in an area of land after myxomatosis had effectively prevented rabbit grazing.
Source : (a) After Leroy & de Vuyst (2001). (b) After Bouzille et al . (1997). (c) After Alliende & Harper (1989).
Intraspecific competition will be obvious in certain cases (such as overgrowth competition between sessile organisms on a rocky shore), but this will not be true of every population examined. Individuals are also affected by predators, parasites and prey, competitors from other species, and the many facets of their physical and chemical environment. Any of these may outweigh or obscure the effects of intraspecific competition; or the effect of these other factors at one stage may reduce the density to well below the carrying capacity for all subsequent stages. Nevertheless, intraspecific competition probably affects most populations at least sometimes during at least one stage of their life cycle.
APPLICATION 5.2 Human population growth and a global carrying capacity
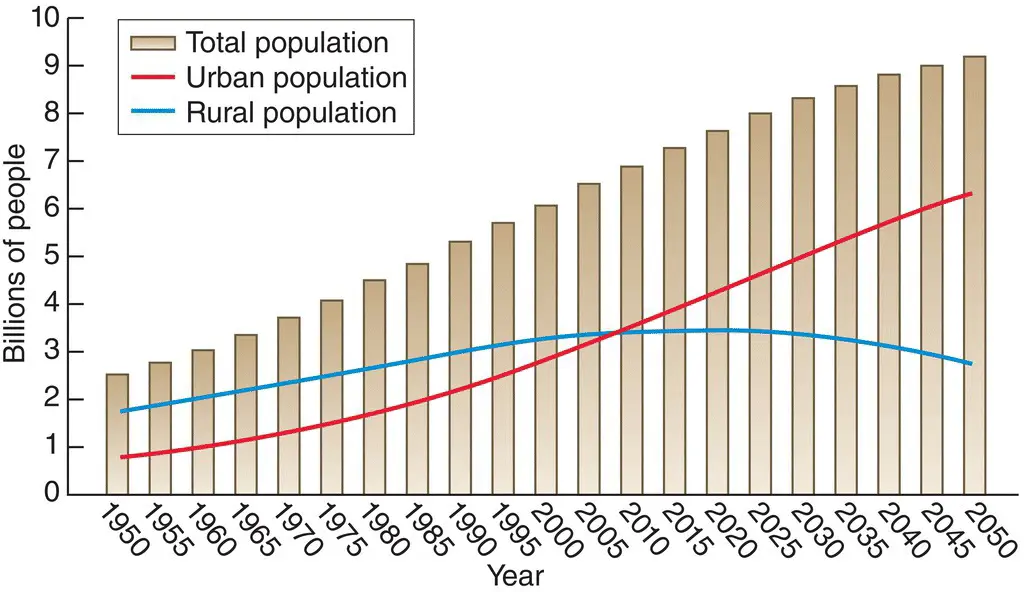
The root of many of the environmental problems facing us is a large and growing global human population. More people means more competition: for renewable resources like fish and forests, for food production from agriculture, but also for energy, and non‐renewable resources like oil and minerals. During the first half of the 20th century, the global population increased by 40%, from 1.8 to 2.5 billion people. But since then the population has almost tripled to over seven billion. What’s more, the percentage of people living in cities has also grown steadily ( Figure 5.16). By 2010, the number of city dwellers had equalled the number in rural environments for the first time in history, and the United Nations predicts that this trend will continue, with two‐thirds of the global population living in cities by 2050. The human population is growing ever larger and getting disproportionately crowded. We have seen through this chapter that the normal consequence, when populations grow, is that competition eventually slows that rate of growth and ultimately stops it, and that the overall size of the population settles, if not at a fixed carrying capacity, then within some regulated band. Is this what we’ve seen with the human population?

Figure 5.16 The global urban population has overtaken its rural counterpart and will probably run away from it.The sizes of the total, rural and urban populations of the world from 1950 to 2010, and projections from the United Nations up to 2050.
Source : After UNEP (2014).
population growth up to the present
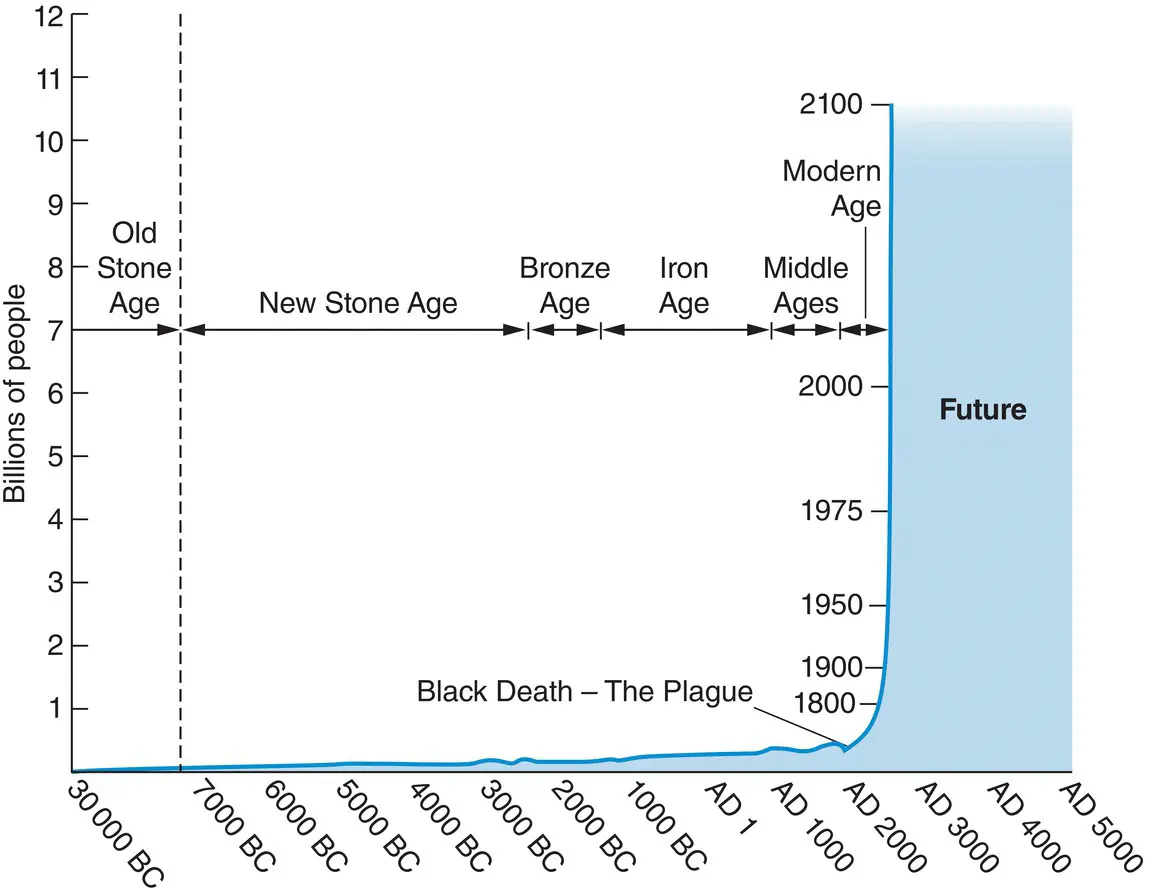
With exponential growth ( Section 5.6), the population as a whole grows at an accelerating rate simply because the growth rate is a product of a constant individual rate of increase and the accelerating number of individuals. For thousands of years, the growth of the global human population appears indeed to have been exponential ( Figure 5.17). But the growth rate was slow, despite a jump around 10 000 years ago at the dawn of agriculture. More recently, however, with growing urbanisation and industrialisation, growth, far from slowing, accelerated to become faster than exponential for several centuries because the per capita rate itself increased. Only very recently has the rate slowed again.

Figure 5.17 The global human population grew slowly for millennia but has recently shown faster than exponential growth.The estimated size of the global human population over the past 30 000 years and projected into the future.
Source : After Population Reference Bureau (2006).
Are these modest indications of a slow‐down a sign that competition is intensifying? If so, this is far from being the whole story. We humans already appropriate a high proportion of the global plant production for our own uses (discussed further in Application 20.2), and average food consumption per person has not been falling, as it would with intensifying competition, but rising. It has increased steadily over the past 50 years, from 2360 calories per day in the mid‐1960s to 2940 calories today (WHO, 2013). Both figures exceed the 2250 calories per day estimated by the US National Institutes of Health to be sufficient for a moderately active adult. Of course, hunger and malnutrition remain major problems in many areas, with perhaps one billion people receiving insufficient food. Yet even in developing countries, average consumption has increased from 2054 calories per day in the 1960s to 2850 today. Hunger results not from inadequate global food production but from unequal distribution.
demographic transitions
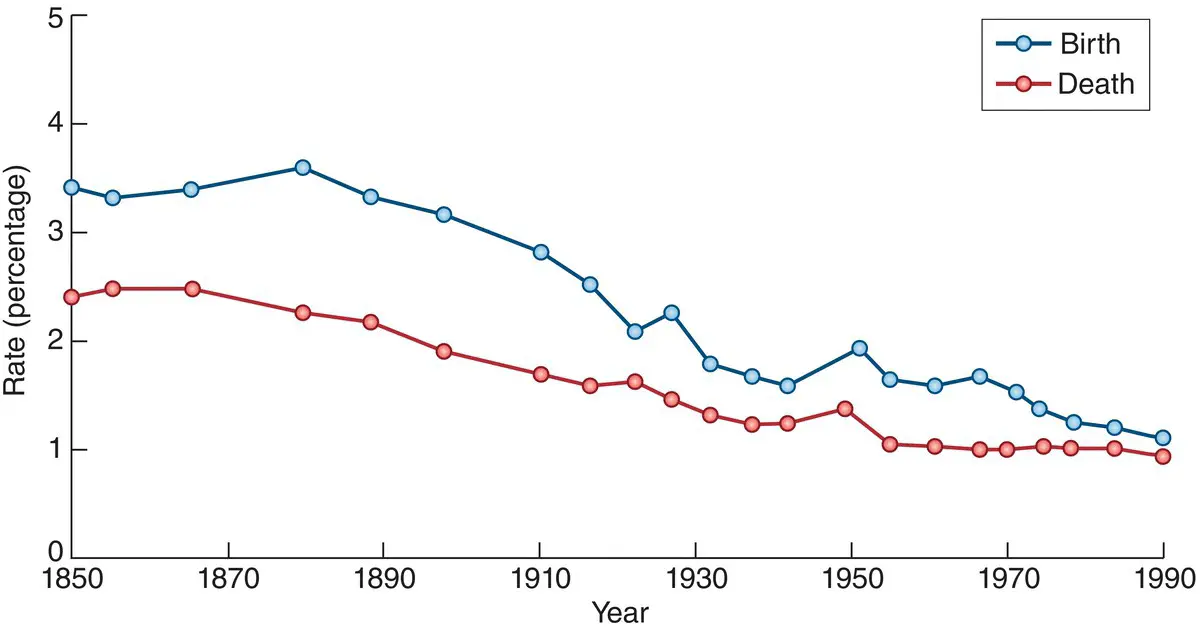
In fact, the slow‐down in population growth seems to have less to do with a direct effect of resource shortages than with a change in individuals’ social conditions and decision‐making. In particular, we have seen in human populations in many parts of the world a demographic transition –a switch from a combination of high birth and death rates to one of low birth and death rates. Indeed, we can distinguish three categories of human population: those that passed through this demographic transition before 1945 (‘early’) ( Figure 5.18), those that have passed through one since 1945 (‘late’), and those that have not yet passed through the transition. The pattern is as follows. Initially, both the birth rate and the death rate are high, but the former is only slightly greater than the latter, so the overall rate of population increase is only moderate or small. As we saw in Figure 5.17, this, broadly, was the case for the global human population until around 300 years ago. Next, the death rate declines while the birth rate remains high, so the population growth rate increases, giving us the more‐than‐exponential rate we also saw in Figure 5.17. Next, however, the birth rate also declines until it is similar to or perhaps even lower than the death rate. Hence, the population growth rate eventually declines again and may even become negative, though with a far larger population than before the transition began.

Figure 5.18 The birth and death rates in Europe since 1850.The annual net rate of population growth is given by the gap between the two. Death rates declined in the late 19th century, followed decades later by a decline in birth rates, leading ultimately to a narrowing of the gap between the two.
Читать дальше


