Michael Begon - Ecology
Здесь есть возможность читать онлайн «Michael Begon - Ecology» — ознакомительный отрывок электронной книги совершенно бесплатно, а после прочтения отрывка купить полную версию. В некоторых случаях можно слушать аудио, скачать через торрент в формате fb2 и присутствует краткое содержание. Жанр: unrecognised, на английском языке. Описание произведения, (предисловие) а так же отзывы посетителей доступны на портале библиотеки ЛибКат.

- Название:Ecology
- Автор:
- Жанр:
- Год:неизвестен
- ISBN:нет данных
- Рейтинг книги:5 / 5. Голосов: 1
-
Избранное:Добавить в избранное
- Отзывы:
-
Ваша оценка:
Ecology: краткое содержание, описание и аннотация
Предлагаем к чтению аннотацию, описание, краткое содержание или предисловие (зависит от того, что написал сам автор книги «Ecology»). Если вы не нашли необходимую информацию о книге — напишите в комментариях, мы постараемся отыскать её.
– now in full colour – offers students and practitioners a review of the ecological sciences.
The previous editions of this book earned the authors the prestigious ‘Exceptional Life-time Achievement Award’ of the British Ecological Society – the aim for the fifth edition is not only to maintain standards but indeed to enhance its coverage of Ecology.
In the first edition, 34 years ago, it seemed acceptable for ecologists to hold a comfortable, objective, not to say aloof position, from which the ecological communities around us were simply material for which we sought a scientific understanding. Now, we must accept the immediacy of the many environmental problems that threaten us and the responsibility of ecologists to play their full part in addressing these problems. This fifth edition addresses this challenge, with several chapters devoted entirely to applied topics, and examples of how ecological principles have been applied to problems facing us highlighted throughout the remaining nineteen chapters.
Nonetheless, the authors remain wedded to the belief that environmental action can only ever be as sound as the ecological principles on which it is based. Hence, while trying harder than ever to help improve preparedness for addressing the environmental problems of the years ahead, the book remains, in its essence, an exposition of the
of ecology. This new edition incorporates the results from more than a thousand recent studies into a fully up-to-date text.
Written for students of ecology, researchers and practitioners, the fifth edition of
is anessential reference to all aspects of ecology and addresses environmental problems of the future.
Ecology — читать онлайн ознакомительный отрывок
Ниже представлен текст книги, разбитый по страницам. Система сохранения места последней прочитанной страницы, позволяет с удобством читать онлайн бесплатно книгу «Ecology», без необходимости каждый раз заново искать на чём Вы остановились. Поставьте закладку, и сможете в любой момент перейти на страницу, на которой закончили чтение.
Интервал:
Закладка:
5.4.1 Carrying capacities
Figures 5.12a–c reiterate the fact that as density increases, the per capita birth rate eventually falls and the per capita death rate eventually rises. There must, therefore, be a density at which these curves cross. At densities below this point, the birth rate exceeds the death rate and the population increases in size. At densities above the crossover point, the death rate exceeds the birth rate and the population declines. At the crossover density itself, the two rates are equal and there is no net change in population size. This density therefore represents a stable equilibrium, in that all other densities will tend to approach it. In other words, intraspecific competition, by acting on birth rates and death rates, can regulate populations at a stable density at which the birth rate equals the death rate. This density is known as the carrying capacity of the population and is usually denoted by K ( Figure 5.12). It is called a carrying capacity because it represents the population size that the resources of the environment can just maintain (‘carry’) without a tendency to either increase or decrease.
real populations lack simple carrying capacities
However, while hypothetical populations caricatured by line drawings like Figures 5.12a–c can be characterised by a simple carrying capacity, this is not true of any natural population. There are unpredictable environmental fluctuations, individuals are affected by a whole wealth of factors of which intraspecific competition is only one, and resources not only affect density but respond to density as well. Hence, the situation is likely to be closer to that depicted in Figure 5.12d. Intraspecific competition does not hold natural populations to a predictable and unchanging level (the carrying capacity), but it may act upon a very wide range of starting densities and bring them to a much narrower range of final densities, and it therefore tends to keep density within certain limits. It is in this sense that intraspecific competition may be said typically to be capable of regulating population size.
In fact, the concept of a population settling at a stable carrying capacity, even in caricatured populations, is relevant only to situations in which density dependence is not strongly overcompensating. Where there is overcompensation, cycles or even chaotic changes in population size may be the result. We return to this point later (see Section 5.6.5).
5.4.2 Net recruitment curves
peak recruitment occurs at intermediate densities
An alternative general view of intraspecific competition is shown in Figure 5.13a, which deals with numbers rather than rates. The difference there between the births curve and the deaths curve is ‘net recruitment’, the net number of additions expected in the population during the appropriate stage or over one interval of time. Because of the shapes of the curves, the net number of additions is small at the lowest densities, increases as density rises, declines again as the carrying capacity is approached and is then negative (deaths exceed births) when the initial density exceeds K ( Figure 5.13b). Thus, total recruitment into a population is small when there are few individuals available to give birth, and small when intraspecific competition is intense. It reaches a peak, i.e. the population increases in size most rapidly, at some intermediate density.
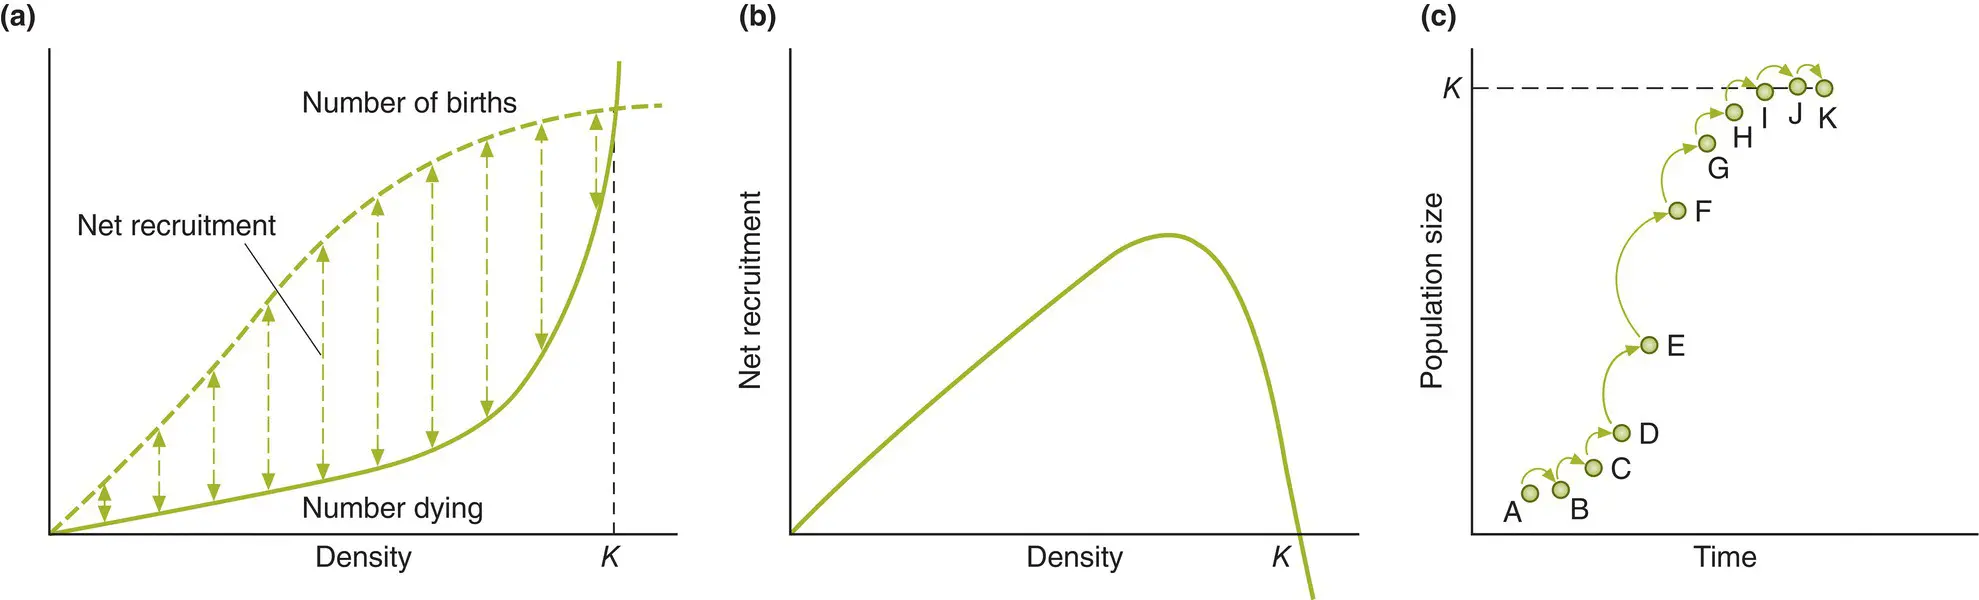
Figure 5.13 Intraspecific competition typically generates n‐shaped net recruitment curves and S‐shaped growth curves.(a) Density‐dependent effects on the numbers dying and the number of births in a population: net recruitment is ‘births minus deaths’. Hence, as shown in (b), the density‐dependent effect of intraspecific competition on net recruitment is a domed or ‘n’‐shaped curve. (c) A population increasing in size under the influence of the relationships in (a) and (b). Each arrow represents the change in size of the population over one interval of time. Change (i.e. net recruitment) is small when density is low (i.e. at small population sizes: A to B, B to C) and is small close to the carrying capacity (I to J, J to K), but is large at intermediate densities (E to F). The result is an ‘S’‐shaped or sigmoidal pattern of population increase, approaching the carrying capacity.
The precise nature of the relationship between a population’s net rate of recruitment and its density varies with the detailed biology of the species concerned (e.g. the trout, wildebeest and clover plants in Figure 5.14a–c). Moreover, because recruitment is affected by a whole multiplicity of factors, the data points rarely fall exactly on any single curve. Yet, in each case in Figure 5.14, a domed curve is apparent. This reflects the general nature of density‐dependent birth and death whenever there is intraspecific competition. Note also that one of these ( Figure 5.14c) is modular: it describes the relationship between the leaf area index (LAI) of a plant population (the total leaf area being borne per unit area of ground) and the population’s growth rate (modular birth minus modular death). The growth rate is low when there are few leaves, peaks at an intermediate LAI, and is then low again at a high LAI, where there is much mutual shading and competition and many leaves may be consuming more in respiration than they contribute through photosynthesis. We return to these net recruitment curves in Section 15.3 when we look in detail at how natural populations (fisheries, forests) may be exploited – pushed from right to left along their net recruitment curves – in order to optimise the sustainable harvest we can take from them.

Figure 5.14 Some dome‐shaped net‐recruitment curves.(a) Six‐month old brown trout, Salmo trutta , in Black Brows Beck, UK, between 1967 and 1989. (b) Wildebeest, Connochaetes taurinus , in the Serengeti, Tanzania 1959–95. (c) The relationship between crop growth rate of subterranean clover, Trifolium subterraneum , and population size (leaf area index) at various intensities of radiation (0.4–3 kJ cm −2day −1).
Source : (a) After Myers (2001), following Elliott (1994). (b) After Mduma et al . (1999). (c) After Black (1963).
back to an integral projection model of Soay sheep
Finally here, we return to Figure 4.17, where integral projection models were used to combine density‐dependent patterns of growth, survival and fecundity for Soay sheep in Scotland in order to estimate how a population’s net reproductive rate will itself vary with abundance. We saw, as we have now come to expect, that as abundance increased the net reproductive rate, R , declined ( Figure 4.17e). What is also apparent now is that ln R (= r ) was equal to zero ( R = 1) at a population size of around 455 sheep, which is therefore the predicted carrying capacity of the population, and an equilibrium, with positive values of ln R at population sizes smaller than this, but negative values at population sizes larger.
5.4.3 Sigmoidal growth curves
Curves of the type shown in Figure 5.13a and b may also be used to suggest the pattern by which a population might increase from an initially very small size (e.g. when a species colonises a previously unoccupied area). This is illustrated in Figure 5.13c. Imagine a small population, well below the carrying capacity of its environment (point A). Because the population is small, it increases in size only slightly during one time interval, and only reaches point B. Now, however, being larger, it increases in size more rapidly during the next time interval (to point C), and even more during the next (to point D). This process continues until the population passes beyond the peak of its net recruitment curve ( Figure 5.13b). Thereafter, the population increases in size less and less with each time interval until the population reaches its carrying capacity ( K ) and ceases completely to increase in size. The population might therefore be expected to follow an S‐shaped or ‘sigmoidal’ curve as it rises from a low density to its carrying capacity. This is a consequence of the hump in its recruitment rate curve, which is itself a consequence of intraspecific competition.
Читать дальшеИнтервал:
Закладка:
Похожие книги на «Ecology»
Представляем Вашему вниманию похожие книги на «Ecology» списком для выбора. Мы отобрали схожую по названию и смыслу литературу в надежде предоставить читателям больше вариантов отыскать новые, интересные, ещё непрочитанные произведения.


Обсуждение, отзывы о книге «Ecology» и просто собственные мнения читателей. Оставьте ваши комментарии, напишите, что Вы думаете о произведении, его смысле или главных героях. Укажите что конкретно понравилось, а что нет, и почему Вы так считаете.