Malcolm J. Crocker - Engineering Acoustics
Здесь есть возможность читать онлайн «Malcolm J. Crocker - Engineering Acoustics» — ознакомительный отрывок электронной книги совершенно бесплатно, а после прочтения отрывка купить полную версию. В некоторых случаях можно слушать аудио, скачать через торрент в формате fb2 и присутствует краткое содержание. Жанр: unrecognised, на английском языке. Описание произведения, (предисловие) а так же отзывы посетителей доступны на портале библиотеки ЛибКат.

- Название:Engineering Acoustics
- Автор:
- Жанр:
- Год:неизвестен
- ISBN:нет данных
- Рейтинг книги:3 / 5. Голосов: 1
-
Избранное:Добавить в избранное
- Отзывы:
-
Ваша оценка:
Engineering Acoustics: краткое содержание, описание и аннотация
Предлагаем к чтению аннотацию, описание, краткое содержание или предисловие (зависит от того, что написал сам автор книги «Engineering Acoustics»). Если вы не нашли необходимую информацию о книге — напишите в комментариях, мы постараемся отыскать её.
Engineering Acoustics — читать онлайн ознакомительный отрывок
Ниже представлен текст книги, разбитый по страницам. Система сохранения места последней прочитанной страницы, позволяет с удобством читать онлайн бесплатно книгу «Engineering Acoustics», без необходимости каждый раз заново искать на чём Вы остановились. Поставьте закладку, и сможете в любой момент перейти на страницу, на которой закончили чтение.
Интервал:
Закладка:
In the case of random sound or vibration signal we define a power spectral density G x( f ). This may be derived through the filtering – squaring – averaging approach or the finite Fourier transform approach. We will consider both approaches in turn.
Suppose we filter the time signal through a filter of bandwidth Δ f , then the mean square value
(1.13) 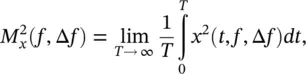
where x ( t , f ,Δ f ) is the filtered frequency component of the signal after it is passed through a filter of bandwidth Δ f centered on frequency f . In the practical case, the filter bandwidth, Δ f , could be, for example, a one‐third octave or smaller. The power spectral density is defined as:
(1.14) 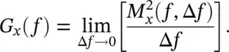
The power spectral density may also be defined via the finite Fourier transform [12, 13]
(1.15) 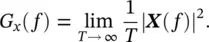
Note the difference between Eqs. (1.15)and (1.12). We notice that G xmust be a power spectral density because of the division by time. The unit of power spectral density is U 2/Hz, where U is the unit of the measured signal. The square root of the power spectral density, often called the rms spectral density , has a unit of  . For discussion in greater detail on analysis of random signals the reader is referred to References 1, 2, 7–9. Often in practice we define a new spectral density
 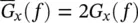 which does not contain energy at negative frequencies but only exists in the region 0 < f < ∞. The power spectral density of the random noise in Figure 1.5is plotted in Figure 1.8.
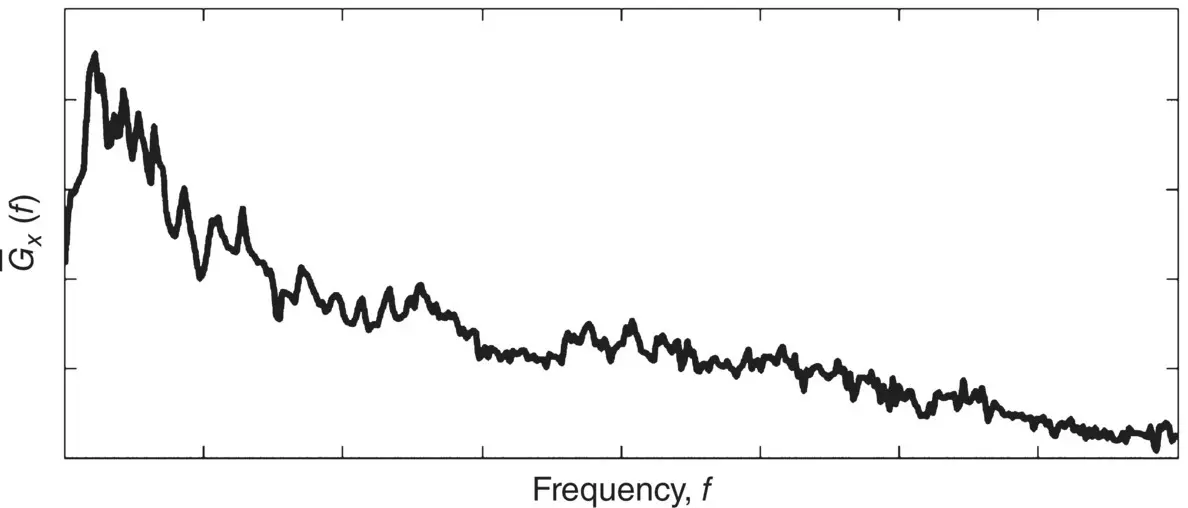
Figure 1.8 Power spectral density of random noise.
1.4 Frequency Analysis Using Filters
Sound and vibration signals can be combined, but they can also be broken down into frequency components as shown by Fourier over 200 years ago. The ear seems to work as a frequency analyzer. We also can make instruments to analyze sound signals into frequency components.
In order to determine experimentally the contribution of the overall signal in some particular frequency band we filter the signal. Most of the important points concerning filters can be observed from a simple R–C passive circuit. By passive we mean that no electrical power is supplied. However, practical filters are usually made from more complicated R–C passive filters or active filters, involving R–C components, inductances, amplifiers, and a power supply. Modern digital signal processing can also be used to filter a signal. Digital filters are implemented through a series of digital operations (addition, multiplication, and time delay) on a digitized signal [3, 5, 14].
In a high‐pass filter, only high‐frequency signals are passed without attenuation. An ideal high‐pass filter would pass no signal below the cutoff frequency and would have a vertical “skirt,” which is impossible to achieve by use of a simple RC passive filter. Practical high‐pass filters have more complicated circuits and normally incorporate inductances and/or active components. High‐pass filters are often used when the displacement signal from a transducer is analyzed. This is because frequently the high‐frequency displacement is of interest and large amplitude low‐frequency signals must be filtered out to prevent the dynamic range of the instrumentation from being exceeded.
In a low‐pass filter only low‐frequency signals are passed without attenuation. In practice, the skirt of a simple RC filter is usually not steep enough and a more complicated circuit is also needed. In modern noise and vibration instrumentation, low‐pass filters are often used as anti‐aliasing filters at the input of an analog‐to‐digital converter (ADC) to suppress unwanted high‐frequency signals. Aliasing errors occur when signals at high frequency (above the upper frequency limit) are interpreted as lower frequency signals below the upper frequency limit.
In a band‐stop (or band‐rejection) filter most frequencies are passed without attenuation; but those frequencies in a specific range are attenuated to very low levels. It is the opposite of a band‐pass filter. Band‐stop filters are commonly used as anti‐hum filters and to remove specific interference frequencies in a complex signal.
By combining the simple high‐pass and low‐pass filters, a simple band‐pass filter is produced. In a band‐pass filter all simple harmonic frequency signals within a band are passed with little, if any, attenuation. All signals outside this band are attenuated. In practice it is usually desirable to make the skirts of such a filter steeper. This requires the use of additional electrical circuit elements and/or the use of active filters. Figure 1.9illustrates the filtering process and shows only the magnitude of the signals in the frequency domain [10].
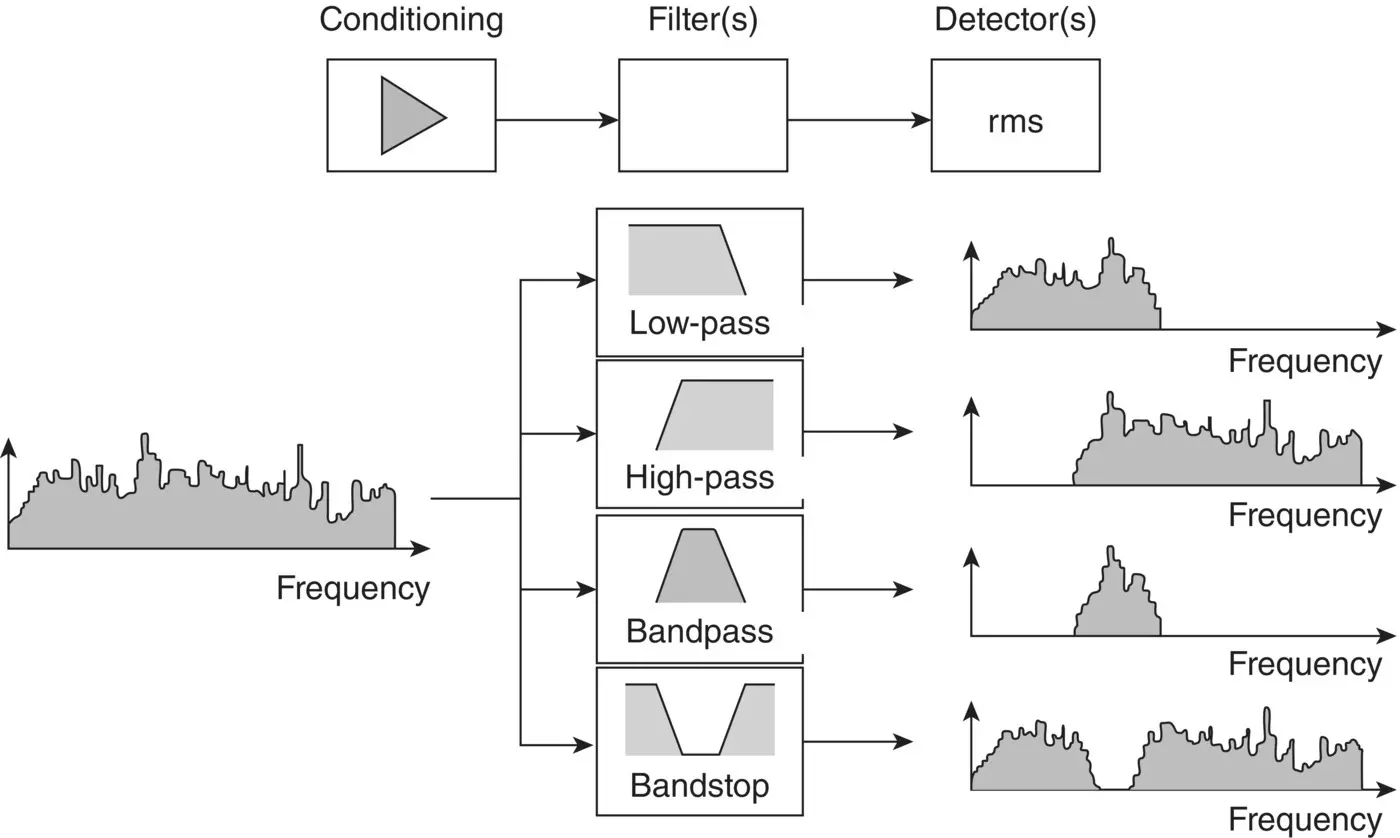
Figure 1.9 Different types of filter. Low‐pass, high‐pass, band‐pass, and band‐stop [10].
Band‐pass filters are frequently used in acoustics and vibration. A frequency weighting network such as A‐weighting is a special kind of band‐pass filter. Frequency analysis using band‐pass filters is commonly carried out using (i) constant frequency band filters and (ii) constant percentage filters. The following symbol notation is used in the characterization of a band‐pass filter: f Land f Uare the lower and upper cutoff frequencies, and f Cand Δ f are the band center frequency and the frequency bandwidth, respectively. Thus Δ f = f U− f L. See Figure 1.10.
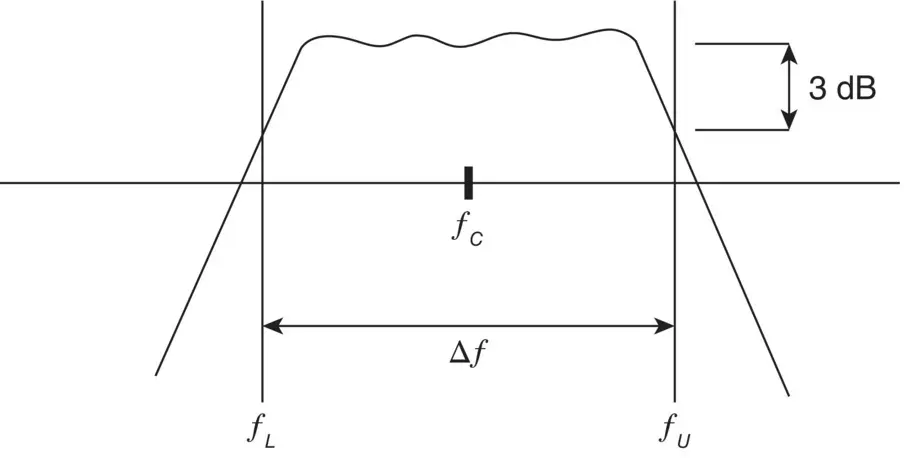
Figure 1.10 Typical frequency response of a filter of center frequency f Cand upper and lower cutoff frequencies, f Uand f L.
In constant bandwidth filters, the bandwidth Δ f = f U− f Lis kept constant regardless of the setting of the filter center frequency.
The constant percentage filter (usually one‐octave or one‐third‐octave band types) most parallels the way the human auditory system analyzes sound and, although digital processing has mostly overtaken analog processing of signals, it is still frequently used. The human audible range is spanned by just a few octaves, so octave analysis produces a relatively coarse classification. Resolution can be improved by breaking each octave band into fractional‐octave bands, which preserves the logarithmic band spacing. Thus, if the frequency scale is divided into contiguous frequency bands, the ratio f U/ f Lis the same for each band. The center frequency f Cfor each band is defined as the geometric mean which is in the middle between f Land f Uon a logarithmic frequency scale and is always less than the arithmetic average. Thus, the ratio of center frequencies of contiguous bands is the same as f U/ f Lfor any one band. Octave and third‐octave band filters are widely used, in particular for acoustical measurements [12].
Читать дальшеИнтервал:
Закладка:
Похожие книги на «Engineering Acoustics»
Представляем Вашему вниманию похожие книги на «Engineering Acoustics» списком для выбора. Мы отобрали схожую по названию и смыслу литературу в надежде предоставить читателям больше вариантов отыскать новые, интересные, ещё непрочитанные произведения.


Обсуждение, отзывы о книге «Engineering Acoustics» и просто собственные мнения читателей. Оставьте ваши комментарии, напишите, что Вы думаете о произведении, его смысле или главных героях. Укажите что конкретно понравилось, а что нет, и почему Вы так считаете.