Malcolm J. Crocker - Engineering Acoustics
Здесь есть возможность читать онлайн «Malcolm J. Crocker - Engineering Acoustics» — ознакомительный отрывок электронной книги совершенно бесплатно, а после прочтения отрывка купить полную версию. В некоторых случаях можно слушать аудио, скачать через торрент в формате fb2 и присутствует краткое содержание. Жанр: unrecognised, на английском языке. Описание произведения, (предисловие) а так же отзывы посетителей доступны на портале библиотеки ЛибКат.

- Название:Engineering Acoustics
- Автор:
- Жанр:
- Год:неизвестен
- ISBN:нет данных
- Рейтинг книги:3 / 5. Голосов: 1
-
Избранное:Добавить в избранное
- Отзывы:
-
Ваша оценка:
Engineering Acoustics: краткое содержание, описание и аннотация
Предлагаем к чтению аннотацию, описание, краткое содержание или предисловие (зависит от того, что написал сам автор книги «Engineering Acoustics»). Если вы не нашли необходимую информацию о книге — напишите в комментариях, мы постараемся отыскать её.
Engineering Acoustics — читать онлайн ознакомительный отрывок
Ниже представлен текст книги, разбитый по страницам. Система сохранения места последней прочитанной страницы, позволяет с удобством читать онлайн бесплатно книгу «Engineering Acoustics», без необходимости каждый раз заново искать на чём Вы остановились. Поставьте закладку, и сможете в любой момент перейти на страницу, на которой закончили чтение.
Интервал:
Закладка:
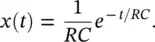
Find the Fourier spectrum representation of this transient response.
Solution
Substituting x ( t ) into Eq. (1.6)we obtain

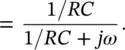
Therefore,
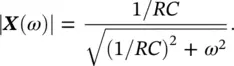
The transient response and its Fourier spectrum are shown in Figure 1.6.
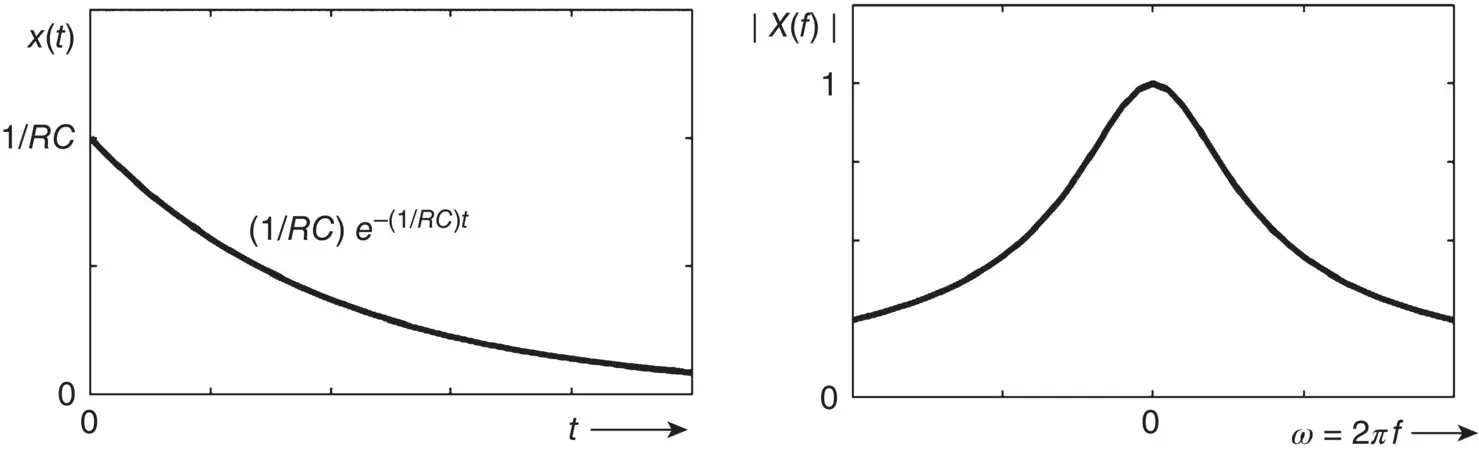
Figure 1.6 Time and frequency domain representations of the transient response of an R–C series circuit.
Example 1.3
The impulse response of a dynamic system is its output in response to a brief input pulse signal, called an impulse. The impulse response of the damped vibration of a one‐degree‐of‐freedom mass‐spring system of mass M , stiffness K , and coefficient of damping R (see Chapter 2of this book) is given by
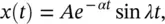
where A = ( Mω d) −1, α = R /2 M and λ = ω dis known as the damped “natural” angular frequency. Find the Fourier spectrum representation of this impulse response.
Solution
Using the mathematical property e jθ= cos θ + j sin θ , we can write
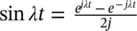 . Then, Eq. (1.6)is
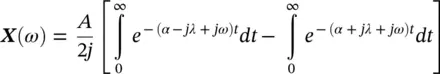

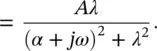
The impulse response and its Fourier spectrum are shown in Figure 1.7. We notice that replacing α and λ by the corresponding values in terms of the stiffness K , mass M , and damping constant R , of the damped mass‐spring system, the Fourier spectrum becomes (compare with Eq. (2.18))
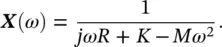
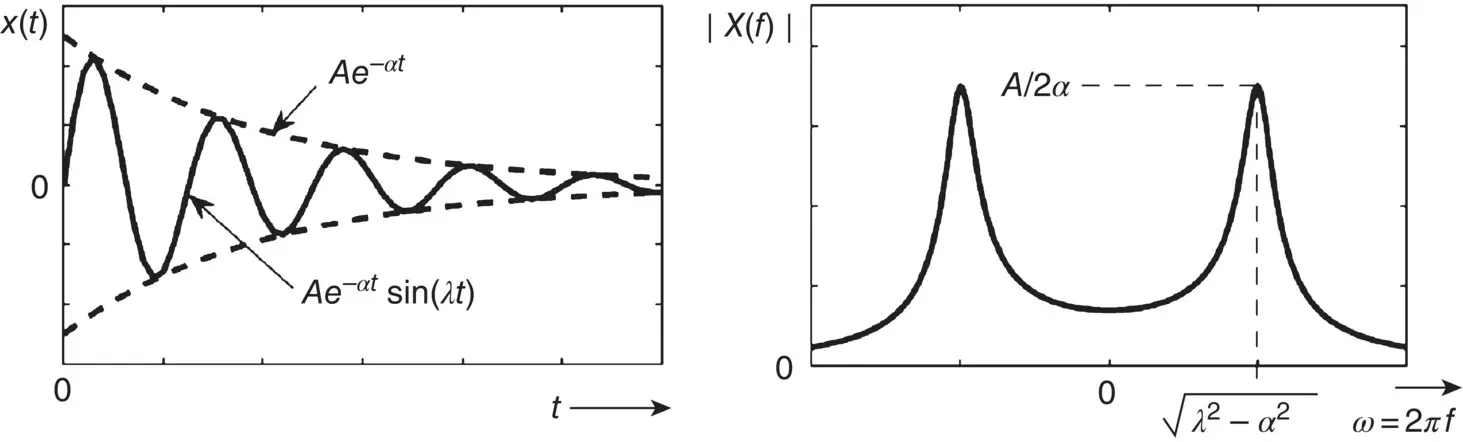
Figure 1.7 Time and frequency domain representations of the transient response of the impulse response of a damped vibration of a mass‐spring system.
1.3.4 Mean Square Values
In the case of the pure tone a useful quantity to determine is the mean square value, i.e. the time average of the signal squared 〈 x 2( t )〉 t[8]
(1.7) 
where 〈〉 tdenotes a time average.
For the pure tone in Figure 1.2a then we obtain
(1.8) 
where A is the signal amplitude.
The root mean square value is given by the square root of 〈 x 2( t )〉 tor
(1.9) 
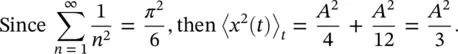
For the general case of the complex pure tone in Eq. (1.1)or (1.2)we obtain:
(1.10) 
or
(1.11) 
since 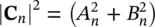 . The mean square value then is the sum of the squares of all the harmonic components of the wave weighted by a constant of 1/2.
Example 1.4
Determine the mean square and rms values of the signal in Figure 1.3.
Solution
We can use Eq. (1.7)to determine its mean square value,
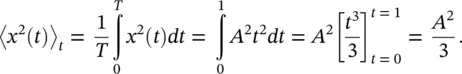
The same result is obtained from its Fourier series representation using Eq. (1.10):

Recalling that the root mean square value is given by the square root of the mean square value, the rms value of this saw tooth signal is  . Note the difference between the rms value obtained in this example and that in Eq. (1.9)for a sine wave.
1.3.5 Energy and Power Spectral Densities
In the case of nonperiodic signals (see Section 1.3.2), a quantity called the energy density function or equivalently the energy spectral density , S ( f ), is defined:
(1.12) 
The energy spectral density S ( f ) is the “energy” of the sound or vibration signal in a bandwidth of 1 Hz. Note that S ( ω ) = 2 πS ( f ) where S ( ω ) is the “energy” in a 1 rad/s bandwidth. We use the term “energy” because if x ( t ) were converted into a voltage signal, S ( ω ) would have the units of energy if the voltage were applied across a 1 Ω resistor. In the case of the pure tone, if x ( t ) is assumed to be a voltage, then the mean square value in Eq. (1.8)represents the power in watts.
Читать дальшеИнтервал:
Закладка:
Похожие книги на «Engineering Acoustics»
Представляем Вашему вниманию похожие книги на «Engineering Acoustics» списком для выбора. Мы отобрали схожую по названию и смыслу литературу в надежде предоставить читателям больше вариантов отыскать новые, интересные, ещё непрочитанные произведения.


Обсуждение, отзывы о книге «Engineering Acoustics» и просто собственные мнения читателей. Оставьте ваши комментарии, напишите, что Вы думаете о произведении, его смысле или главных героях. Укажите что конкретно понравилось, а что нет, и почему Вы так считаете.