Douglas C. Montgomery - Introduction to Linear Regression Analysis
Здесь есть возможность читать онлайн «Douglas C. Montgomery - Introduction to Linear Regression Analysis» — ознакомительный отрывок электронной книги совершенно бесплатно, а после прочтения отрывка купить полную версию. В некоторых случаях можно слушать аудио, скачать через торрент в формате fb2 и присутствует краткое содержание. Жанр: unrecognised, на английском языке. Описание произведения, (предисловие) а так же отзывы посетителей доступны на портале библиотеки ЛибКат.
- Название:Introduction to Linear Regression Analysis
- Автор:
- Жанр:
- Год:неизвестен
- ISBN:нет данных
- Рейтинг книги:4 / 5. Голосов: 1
-
Избранное:Добавить в избранное
- Отзывы:
-
Ваша оценка:
Introduction to Linear Regression Analysis: краткое содержание, описание и аннотация
Предлагаем к чтению аннотацию, описание, краткое содержание или предисловие (зависит от того, что написал сам автор книги «Introduction to Linear Regression Analysis»). Если вы не нашли необходимую информацию о книге — напишите в комментариях, мы постараемся отыскать её.
New exercises and data sets New material on generalized regression techniques The inclusion of JMP software in key areas Carefully condensing the text where possible
skillfully blends theory and application in both the conventional and less common uses of regression analysis in today's cutting-edge scientific research. The text equips readers to understand the basic principles needed to apply regression model-building techniques in various fields of study, including engineering, management, and the health sciences.
Introduction to Linear Regression Analysis — читать онлайн ознакомительный отрывок
Ниже представлен текст книги, разбитый по страницам. Система сохранения места последней прочитанной страницы, позволяет с удобством читать онлайн бесплатно книгу «Introduction to Linear Regression Analysis», без необходимости каждый раз заново искать на чём Вы остановились. Поставьте закладку, и сможете в любой момент перейти на страницу, на которой закончили чтение.
Интервал:
Закладка:

Table 2.6 contains the 95% confidence limits on E ( y | x 0) for several other values of x 0. These confidence limits are illustrated graphically in Figure 2.4. Note that the width of the CI increases as  increases.
TABLE 2.6 Confidence Limits on E(y|x0) for Several Values of x0
| Lower Confidence Limit | x 0 | Upper Confidence Limit |
| 2438.919 | 3 | 2593.821 |
| 2341.360 | 6 | 2468.481 |
| 2241.104 | 9 | 2345.836 |
| 2136.098 | 12 | 2227.942 |
| 2086.230 |  |
2176.571 |
| 2024.318 | 15 | 2116.822 |
| 1905.890 | 18 | 2012.351 |
| 1782.928 | 21 | 1912.412 |
| 1657.395 | 24 | 1815.045 |
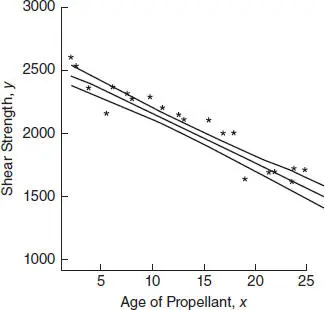
Figure 2.4 The upper and lower 95% confidence limits for the propellant data.
Many regression textbooks state that one should never use a regression model to extrapolatebeyond the range of the original data. By extrapolation, we mean using the prediction equation beyond the boundary of the x space. Figure 1.5illustrates clearly the dangers inherent in extrapolation; model or equation error can severely damage the prediction.
Equation (2.43)points out that the issue of extrapolation is much more subtle; the further the x value is from the center of the data, the more variable our estimate of E ( y | x 0). Please note, however, that nothing “magical” occurs at the boundary of the x space. It is not reasonable to think that the prediction is wonderful at the observed data value most remote from the center of the data and completely awful just beyond it. Clearly, Eq. (2.43)points out that we should be concerned about prediction quality as we approach the boundary and that as we move beyond this boundary, the prediction may deteriorate rapidly. Furthermore, the farther we move away from the original region of x space, the more likely it is that equation or model error will play a role in the process.
This is not the same thing as saying “never extrapolate.” Engineers and economists routinely use prediction equations to forecast a variable of interest one or more time periods in the future. Strictly speaking, this forecast is an extrapolation. Equation (2.43)supports such use of the prediction equation. However, Eq. (2.43)does not support using the regression model to forecast many periods in the future. Generally, the greater the extrapolation, the higher is the chance of equation error or model error impacting the results.
The probability statement associated with the CI (2.43)holds only when a single CI on the mean response is to be constructed. A procedure for constructing several CIs that, considered jointly, have a specified confidence level is a simultaneous statistical inferenceproblem. These problems are discussed in Chapter 3.
2.5 PREDICTION OF NEW OBSERVATIONS
An important application of the regression model is prediction of new observations y corresponding to a specified level of the regressor variable x . If x 0is the value of the regressor variable of interest, then
(2.44) 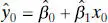
is the point estimate of the new value of the response y 0.
Now consider obtaining an interval estimate of this future observation y 0. The CI on the mean response at x = x 0[ Eq. (2.43)] is inappropriate for this problem because it is an interval estimate on the meanof y (a parameter), not a probability statement about future observations from that distribution. We now develop a prediction interval for the future observation y0.
Note that the random variable

is normally distributed with mean zero and variance
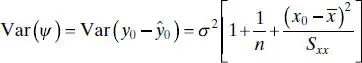
because the future observation y 0is independent of  . If we use
  to predict y 0, then the standard error of
  is the appropriate statistic on which to base a prediction interval. Thus, the 100(1 − α ) percent prediction interval on a future observation at x 0is
(2.45) 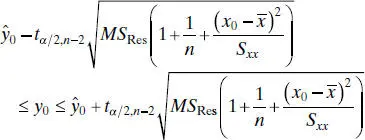
The prediction interval (2.45)is of minimum width at  and widens as
  increases. By comparing (2.45)with (2.43), we observe that the prediction interval at x 0is always wider than the CI at x 0because the prediction interval depends on both the error from the fitted model and the error associated with future observations.
Example 2.7 The Rocket Propellant Data
We find a 95% prediction interval on a future value of propellant shear strength in a motor made from a batch of sustainer propellant that is 10 weeks old. Using (2.45), we find that the prediction interval is
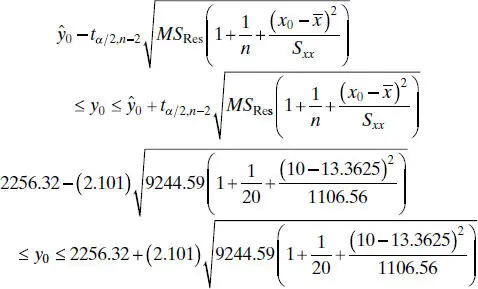
which simplifies to

Therefore, a new motor made from a batch of 10-week-old sustainer propellant could reasonably be expected to have a propellant shear strength between 2048.32 and 2464.32 psi.
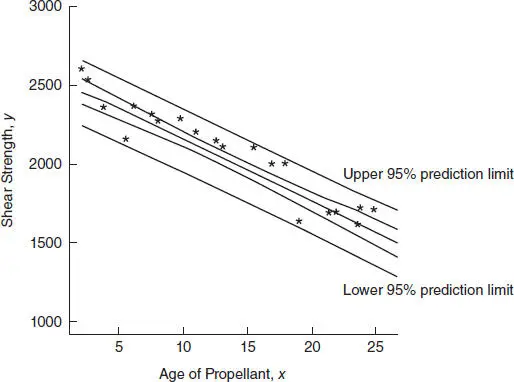
Figure 2.5 The 95% confidence and prediction intervals for the propellant data.
Читать дальшеИнтервал:
Закладка:
Похожие книги на «Introduction to Linear Regression Analysis»
Представляем Вашему вниманию похожие книги на «Introduction to Linear Regression Analysis» списком для выбора. Мы отобрали схожую по названию и смыслу литературу в надежде предоставить читателям больше вариантов отыскать новые, интересные, ещё непрочитанные произведения.


Обсуждение, отзывы о книге «Introduction to Linear Regression Analysis» и просто собственные мнения читателей. Оставьте ваши комментарии, напишите, что Вы думаете о произведении, его смысле или главных героях. Укажите что конкретно понравилось, а что нет, и почему Вы так считаете.