B. McCullough - Business Experiments with R
Здесь есть возможность читать онлайн «B. McCullough - Business Experiments with R» — ознакомительный отрывок электронной книги совершенно бесплатно, а после прочтения отрывка купить полную версию. В некоторых случаях можно слушать аудио, скачать через торрент в формате fb2 и присутствует краткое содержание. Жанр: unrecognised, на английском языке. Описание произведения, (предисловие) а так же отзывы посетителей доступны на портале библиотеки ЛибКат.

- Название:Business Experiments with R
- Автор:
- Жанр:
- Год:неизвестен
- ISBN:нет данных
- Рейтинг книги:4 / 5. Голосов: 1
-
Избранное:Добавить в избранное
- Отзывы:
-
Ваша оценка:
Business Experiments with R: краткое содержание, описание и аннотация
Предлагаем к чтению аннотацию, описание, краткое содержание или предисловие (зависит от того, что написал сам автор книги «Business Experiments with R»). Если вы не нашли необходимую информацию о книге — напишите в комментариях, мы постараемся отыскать её.
is an essential resource for any business student. This important text:
Presents the key ideas that business students need to know about experiments Offers a series of examples, focusing on specific business questions Helps develop the ability to frame ill-defined problems and determine what data and types of analysis provide information about each problem Contains supplementary material, such as data sets available to everyone and an instructor-only companion site featuring lecture slides and an answer key Written for students of general business, marketing, and business analytics,
is an important text that helps to answer business questions by highlighting the strategic and technical issues involved in designing experiments that will truly affect organizations.
Business Experiments with R — читать онлайн ознакомительный отрывок
Ниже представлен текст книги, разбитый по страницам. Система сохранения места последней прочитанной страницы, позволяет с удобством читать онлайн бесплатно книгу «Business Experiments with R», без необходимости каждый раз заново искать на чём Вы остановились. Поставьте закладку, и сможете в любой момент перейти на страницу, на которой закончили чтение.
Интервал:
Закладка:
Try it!
Use the data in the file SampleSelection.csvto repeat the above analysis by running the regression for the full sample and again only for those observations for which  .
.
These results are consistent with the true intercept of zero and the true slope of unity. Suppose that we only get to observe observations when  . Then the results are
  and
and  . These results are not consistent with the truth: the intercept is significantly above 0, and the slope is significantly below unity. Figure 1.3depicts the situation. Note that for observations close to the cutoff
  , for any value of
  , observations with positive errors will be included in the sample and observations with negative errors will be dropped from the sample. Thus, some values of observed
  are correlated with the error: values of
  close to but above
  are quite likely to have a positive error. This violates one of the assumptions for linear regression to be unbiased. Any time that selection into the sample depends on the value of the dependent variable, sample selection bias is a problem.
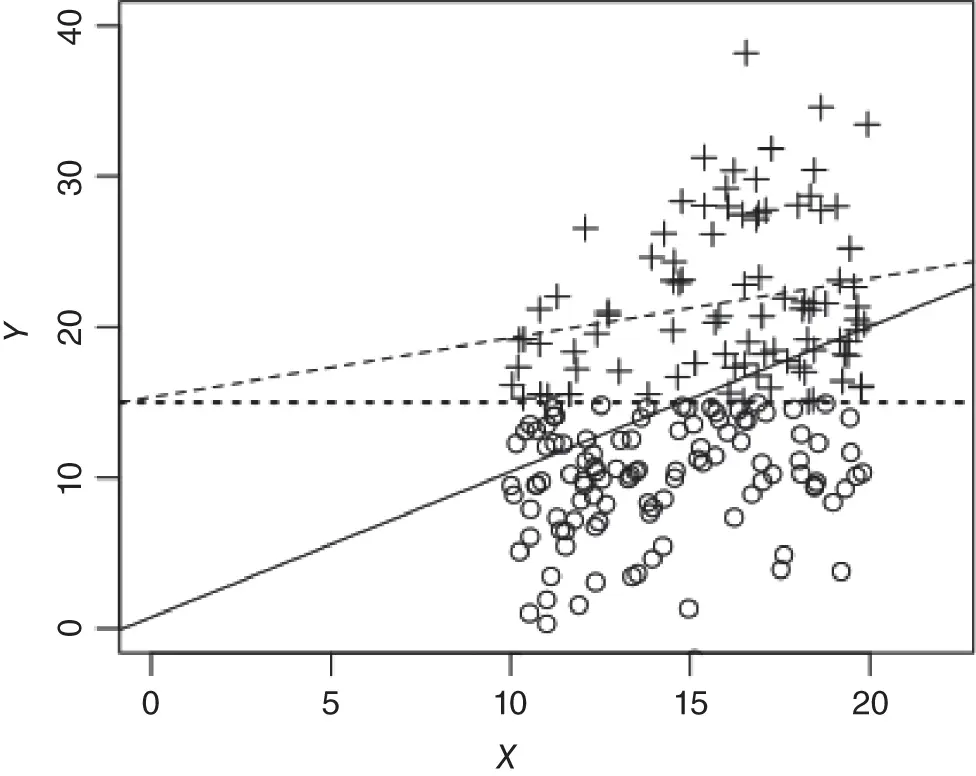
Figure 1.3 Sample selection bias. Dashed line for observations  and solid line for all observations and horizontal dotted line at
  .
.
If we have an umbrella problem and we only want to make a prediction of  for some value of
  when
when  , then there is no difficulty. We can get good predictions of
  for values of
  larger than 15. If we have a rain dance problem and we need a good estimate of the true slope, then clearly we cannot use the regression to determine the effect that a change in
  has upon
  , because the only regression we can run (the dashed line) has a biased slope (see the solid line for the true slope).
Now let us return to the credit example, and suppose that we had lots of variables that included all possible lurking variables. Suppose we knew the model so that there was no garden of forking paths problem. Now, could we really get causal answers out of these data? Suppose we brought in a statistical expert on getting causal results from observational data. Could he do it? The answer is “no.”
Aside from the garden of forking paths, there is a more serious problem with these data, and it is rather subtle. Let us consider where our data came from. People apply for credit. Some are granted credit, while others are not. Of those who are granted credit, some default and some do not. It should be apparent that our data do not constitute a random sample from the population, but a selected sample from the population. In the present case, there is no data on those who were denied credit, some of whom would have defaulted and some of whom would not have defaulted. This is a general problem called sample selection bias , and it plagues observational data; in such a case, the sample is not representative of the population. Let us be more explicit. The population of credit applicants includes four types of persons:
1 Non‐defaulters who get credit.
2 Non‐defaulters who are denied credit.
3 Defaulters who get credit.
4 Defaulters who are denied credit.
Meanwhile, since the sample consists only of persons who have been granted credit, the sample consists only of categories (1) and (3) above and does not look like the population. Therefore, inferences from the sample do not extrapolate to the population, and using such a model would likely be a mistake.
This is a very important problem that bedevils the credit industry, and this problem even has a name: “reject inference,” which is how to conduct inference when there is no data on persons whose credit applications were rejected. Very sophisticated statistical machinery, far beyond the level of this book, has been unleashed on this problem, with only a modicum of success. Indeed, some credit card companies deliberately conduct designed experiments and issue credit to persons who otherwise would have been rejected in order to collect data from categories (2) and (4) so that they may extrapolate their results to the population. However, this is a very expensive solution to the problem, so these types of experiments are rarely performed. The credit card industry largely makes do with sophisticated statistical analyses to answer causal questions.
Finally, there is a modeling problem in the data to which we must draw attention. Suppose there was no reject inference problem, and we knew all the lurking variables. We might run a regression (perhaps a logistic regression, for those of you who know that method) with “default” on the loan as the dependent variable and “age” as one of the independent variables. Suppose further that the coefficient on age is positive and statistically significant. What does this mean?
Such a regression coefficient would not agree with what creditors generally know about the relationship between age and default probability. Based on years of empirical data, they know that young people tend to default more than older people. The nonlinearity in this relationship cannot be captured by a linear regression. What does this nonlinearity mean for our linear regression model? We now have a very substantial modeling problem, and we will get different answers depending on how we model the effect of age on defaults (Is it linear or nonlinear; if nonlinear, what type of nonlinearity?). Does a modeler really want results to be dependent on the choice of how the regression model is built? This is just part of what makes drawing causal inferences from observational data so fraught with danger. When we run experiments, we don't have to worry about any of these things.
Читать дальшеИнтервал:
Закладка:
Похожие книги на «Business Experiments with R»
Представляем Вашему вниманию похожие книги на «Business Experiments with R» списком для выбора. Мы отобрали схожую по названию и смыслу литературу в надежде предоставить читателям больше вариантов отыскать новые, интересные, ещё непрочитанные произведения.


Обсуждение, отзывы о книге «Business Experiments with R» и просто собственные мнения читателей. Оставьте ваши комментарии, напишите, что Вы думаете о произведении, его смысле или главных героях. Укажите что конкретно понравилось, а что нет, и почему Вы так считаете.