Daniel J. Denis - Applied Univariate, Bivariate, and Multivariate Statistics
Здесь есть возможность читать онлайн «Daniel J. Denis - Applied Univariate, Bivariate, and Multivariate Statistics» — ознакомительный отрывок электронной книги совершенно бесплатно, а после прочтения отрывка купить полную версию. В некоторых случаях можно слушать аудио, скачать через торрент в формате fb2 и присутствует краткое содержание. Жанр: unrecognised, на английском языке. Описание произведения, (предисловие) а так же отзывы посетителей доступны на портале библиотеки ЛибКат.

- Название:Applied Univariate, Bivariate, and Multivariate Statistics
- Автор:
- Жанр:
- Год:неизвестен
- ISBN:нет данных
- Рейтинг книги:5 / 5. Голосов: 1
-
Избранное:Добавить в избранное
- Отзывы:
-
Ваша оценка:
Applied Univariate, Bivariate, and Multivariate Statistics: краткое содержание, описание и аннотация
Предлагаем к чтению аннотацию, описание, краткое содержание или предисловие (зависит от того, что написал сам автор книги «Applied Univariate, Bivariate, and Multivariate Statistics»). Если вы не нашли необходимую информацию о книге — напишите в комментариях, мы постараемся отыскать её.
contains an accessible introduction to statistical modeling techniques commonly used in the social and behavioral sciences. The text offers a blend of statistical theory and methodology and reviews both the technical and theoretical aspects of good data analysis.
Featuring applied resources at various levels, the book includes statistical techniques using software packages such as R and SPSS®. To promote a more in-depth interpretation of statistical techniques across the sciences, the book surveys some of the technical arguments underlying formulas and equations. The thoroughly updated edition includes new chapters on nonparametric statistics and multidimensional scaling, and expanded coverage of time series models. The second edition has been designed to be more approachable by minimizing theoretical or technical jargon and maximizing conceptual understanding with easy-to-apply software examples. This important text:
Offers demonstrations of statistical techniques using software packages such as R and SPSS® Contains examples of hypothetical and real data with statistical analyses Provides historical and philosophical insights into many of the techniques used in modern social science Includes a companion website that includes further instructional details, additional data sets, solutions to selected exercises, and multiple programming options Written for students of social and applied sciences,
offers a text to statistical modeling techniques used in social and behavioral sciences.
Applied Univariate, Bivariate, and Multivariate Statistics — читать онлайн ознакомительный отрывок
Ниже представлен текст книги, разбитый по страницам. Система сохранения места последней прочитанной страницы, позволяет с удобством читать онлайн бесплатно книгу «Applied Univariate, Bivariate, and Multivariate Statistics», без необходимости каждый раз заново искать на чём Вы остановились. Поставьте закладку, и сможете в любой момент перейти на страницу, на которой закончили чтение.
Интервал:
Закладка:
2.25 COMPOSITE VARIABLES: LINEAR COMBINATIONS
In many statistical techniques, especially multivariate ones, statistical analyses take place not on individual variables, but rather on linear combinationsof variables. A linear combination in linear algebra can be denoted simply as:
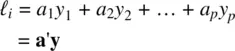
where a' = ( a 1, a 2, …, a p). These values are scalars, and serve to weight the respective values of y 1through y p, which are the variables.
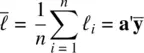
Just as we did for “ordinary” variables, we can compute a number of central tendency and dispersion statistics on linear combinations. For instance, we can compute the mean of a linear combination ℓ ias
We can also compute the sample variance of a linear combination:
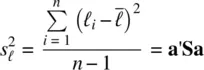
for ℓ i= a′ y, i = 1, 2, …, n , and where Sis the sample covariance matrix. Though the form a′ Safor the variance may be difficult to decipher at this point, it will become clearer when we consider techniques such as principal componentslater in the book.
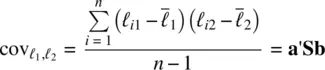
For two linear combinations,

and

we can obtain the sample covariance between such linear combinations as follows:
The correlation of these linear combinations (Rencher and Christensen, 2012, p. 76) is simply the standardized version of  :
:
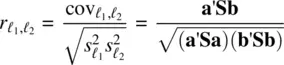
As we will see later in the book, if  is the maximum correlationbetween linear combinations on the same variables, it is called the canonical correlation, discussed in Chapter 12. The correlation between linear combinations plays a central role in multivariate analysis. Substantively, and geometrically, linear combinations can be interpreted as “projections” of one or more variables onto new dimensions. For instance, in simple linear regression, the fitting of a least‐squares line is such a projection. It is the projection of points such that it guarantees that the sum of squared deviations from the given projected line or “surface” (in the case of higher dimensions) is kept to a minimum.
If we can assume multivariate normality of a distribution, that is, Y∼ N[ μ, ∑], then we know linear combinations of Yare also normally distributed, as well as a host of other useful statistical properties (see Timm, 2002, pp. 86–88). In multivariate methods especially, we regularly need to make assumptions about such linear combinations, and it helps to know that so long as we can assume multivariate normality, we have some idea of how such linear combinations will be distributed.
2.26 MODELS IN MATRIX FORM
Throughout the book, our general approach is to first present models in their simplest possible form using only scalars. We then gently introduce the reader to the corresponding matrix counterparts and extensions. The requirement of matrices for such models is to accommodate numerous variables and dimensions. Matrix algebra is the vehicle by which multivariate analysis is communicated, though most of the conceptsof statistics can be communicated using simpler scalar algebra. Knowing matrix algebra for its own sake will not necessarily equate to understanding statistical concepts. Indeed, hiding behind the mathematics of statistics are the philosophically “sticky” issues that mathematics or statistics cannot, on their own at least, claim to solve. These are often the problems confronted by researchers and scientists in their empirical pursuits and attempts to draw conclusions from data. For instance, what is the nature of a “correct” model? Do latent variables exist, or are they only a consequence of generating linear combinations? The nature of a latent variable is not necessarily contingent on the linear algebra that seeks to define it. Such questions are largely philosophical, and if such interest you, you are strongly encouraged to familiarize yourself with the philosophy of statistics and mathematics(you may not always find answers to your questions, but you will appreciate the complexity of such questions, as they are beyond our current study here). For a gentle introduction to the philosophy of statistics, see Lindley (2001).
As an example of how matrices will be used to develop more complete and general models, consider the multivariate general linear model in matrix form:
(2.7) 
where Yis an n x m matrix of n observations on m response variables, Xis the model or “design” matrix whose columns contain k regressors which includes the intercept term, Bis a matrix of regression coefficients, and Eis a matrix of errors. Many statistical models can be incorporated into the framework of (2.7). As a relatively easy application of this general model, consider the simple linear regression model (featured in Chapter 7) in matrix form:
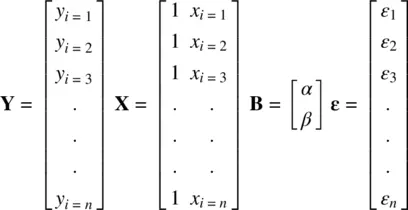
where y i = 1to y i = nare observed measurements on some dependent variable, Xis the model matrix containing a constant of 1 in the first column to represent the common intercept term (i.e., “common” implying there is one intercept that represents all observations in our data), x i = 1to x i = nare observed values on a predictor variable, α is the fixed intercept parameter, β is the slope parameter, which we also assume to be fixed, and εis a vector of errors ε 1to ε n(we use εhere instead of E).
Читать дальшеИнтервал:
Закладка:
Похожие книги на «Applied Univariate, Bivariate, and Multivariate Statistics»
Представляем Вашему вниманию похожие книги на «Applied Univariate, Bivariate, and Multivariate Statistics» списком для выбора. Мы отобрали схожую по названию и смыслу литературу в надежде предоставить читателям больше вариантов отыскать новые, интересные, ещё непрочитанные произведения.


Обсуждение, отзывы о книге «Applied Univariate, Bivariate, and Multivariate Statistics» и просто собственные мнения читателей. Оставьте ваши комментарии, напишите, что Вы думаете о произведении, его смысле или главных героях. Укажите что конкретно понравилось, а что нет, и почему Вы так считаете.