Daniel J. Denis - Applied Univariate, Bivariate, and Multivariate Statistics
Здесь есть возможность читать онлайн «Daniel J. Denis - Applied Univariate, Bivariate, and Multivariate Statistics» — ознакомительный отрывок электронной книги совершенно бесплатно, а после прочтения отрывка купить полную версию. В некоторых случаях можно слушать аудио, скачать через торрент в формате fb2 и присутствует краткое содержание. Жанр: unrecognised, на английском языке. Описание произведения, (предисловие) а так же отзывы посетителей доступны на портале библиотеки ЛибКат.

- Название:Applied Univariate, Bivariate, and Multivariate Statistics
- Автор:
- Жанр:
- Год:неизвестен
- ISBN:нет данных
- Рейтинг книги:5 / 5. Голосов: 1
-
Избранное:Добавить в избранное
- Отзывы:
-
Ваша оценка:
Applied Univariate, Bivariate, and Multivariate Statistics: краткое содержание, описание и аннотация
Предлагаем к чтению аннотацию, описание, краткое содержание или предисловие (зависит от того, что написал сам автор книги «Applied Univariate, Bivariate, and Multivariate Statistics»). Если вы не нашли необходимую информацию о книге — напишите в комментариях, мы постараемся отыскать её.
contains an accessible introduction to statistical modeling techniques commonly used in the social and behavioral sciences. The text offers a blend of statistical theory and methodology and reviews both the technical and theoretical aspects of good data analysis.
Featuring applied resources at various levels, the book includes statistical techniques using software packages such as R and SPSS®. To promote a more in-depth interpretation of statistical techniques across the sciences, the book surveys some of the technical arguments underlying formulas and equations. The thoroughly updated edition includes new chapters on nonparametric statistics and multidimensional scaling, and expanded coverage of time series models. The second edition has been designed to be more approachable by minimizing theoretical or technical jargon and maximizing conceptual understanding with easy-to-apply software examples. This important text:
Offers demonstrations of statistical techniques using software packages such as R and SPSS® Contains examples of hypothetical and real data with statistical analyses Provides historical and philosophical insights into many of the techniques used in modern social science Includes a companion website that includes further instructional details, additional data sets, solutions to selected exercises, and multiple programming options Written for students of social and applied sciences,
offers a text to statistical modeling techniques used in social and behavioral sciences.
Applied Univariate, Bivariate, and Multivariate Statistics — читать онлайн ознакомительный отрывок
Ниже представлен текст книги, разбитый по страницам. Система сохранения места последней прочитанной страницы, позволяет с удобством читать онлайн бесплатно книгу «Applied Univariate, Bivariate, and Multivariate Statistics», без необходимости каждый раз заново искать на чём Вы остановились. Поставьте закладку, и сможете в любой момент перейти на страницу, на которой закончили чтение.
Интервал:
Закладка:
2.23 PAIRED‐SAMPLES t ‐ TEST: STATISTICAL TEST FOR MATCHED‐PAIRS (ELEMENTARY BLOCKING) DESIGNS
Oftentimes in research, we are able to sample observations that are matchedon one or more variables or characteristics. For instance, consider the hypothetical data in Table 2.8.
Table 2.8 Matched-Pairs Design
| Treatment 1 | Treatment 2 | |
|---|---|---|
| Block 1 | 10 | 8 |
| Block 2 | 15 | 12 |
| Block 3 | 20 | 14 |
| Block 4 | 22 | 15 |
| Block 5 | 25 | 24 |
About Table 2.8:
In each block (1 through 5), participants within blocks are assumed to be more homogeneous on one or more variables than participants between blocks.
Participants are randomly assigned to condition (i.e., treatment 1 versus treatment 2) within each block.
Whether the blocks are naturally occurring or our sampling scheme is designed purposely to create the blocks, we can exploit the homogeneity of participants within each block by including this source in our statistical analysis as to potentially reduce the error term of our statistical test.
The matched‐pairs design is a simpler version of the full‐blown randomized block design in which one can have more than just two levels of the independent variable (e.g., treatment 1 versus treatment 2 versus treatment 3). However, the principle behind the matched-pairs design and that of randomized block designs is the same, that of exploiting the covariance between conditions and removing it from the error term of the test statistic (t in matched‐pairs, F in randomized block designs).
In more advanced analyses such as repeated measures, longitudinal, and mixed effects modeling, we will say that subjects are nested within block. A nesting structure simply implies that subjects within a block share similarity compared to subjects between blocks. Good statistical analyses will attempt to account for this similarity, remove it from respective error terms for tests, and hence make the statistical test for effects more sensitive (i.e., more powerful).
As an example of a matched‐pairs situation, suppose we are interested in evaluating the effects of melatonin 12 dose on average hours of sleep. However, we know that due to age, some people will naturally sleep longer than others irrespective of how much melatonin they receive. We do not want this natural sleep tendency due to age to confound the effect we are actually interested in studying (i.e., that of melatonin dose), and so we will match participants on their age level, or perhaps even crudely on age group(e.g., young, middle‐aged, old), and carry out our study within each age group. Then, when we perform statistical analyses, we will be able to extract this variation due to age out of the error term of the analysis, and hence boost statistical power for estimating the effect we are actually interested in (melatonin dosage).
When we sample observations in pairs, as was true for the independent samples t ‐test, the expectation of the difference between sample means is given by:

However, because observations are sampled (or “matched”) in pairs, we naturally expect there to be a covariance different from zero between pairs. We can exploit this covariance and remove it from the error term of our statistical test. As given in Hays (1994, p. 339), the variance of the difference becomes
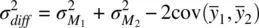
with standard error equal to
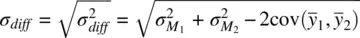
Notice that we have subtracted  from the denominator of our statistic. Assuming the covariance between pairs is unequal to 0, this will serve to lowerthe standard error of our statistic, and hence, boost statistical power. In practice, this is accomplished by conducting a t ‐test on the difference scoresbetween samples. As Hays (1994, p. 339) notes, “the matching and the consequent dependencewithin the pairs changes the standard error of the difference between the sample means.”
In the classic between‐subjects design where participants are not matched, the expectation is that covariance between treatments is equal to 0, and hence, we would have:

The matched-pairs design is a very important concept in statistics and design of experiments, because this simple design is the starting point to understanding more complicated designs and modeling such as mixed effects and hierarchical models.
We analyze the hypothetical data in Table 2.8using a paired samples t ‐test in R by requesting paired = TRUE:
> treat <- c(10, 15, 20, 22, 25) > control <- c(8, 12, 14, 15, 24) > t.test(treat, control, paired = TRUE) Paired t-test data: treat and control t = 3.2827, df = 4, p-value = 0.03042 alternative hypothesis: true difference in means is not equal to 0 95 percent confidence interval: 0.5860324 7.0139676 sample estimates: mean of the differences 3.8
The obtained p ‐value of 0.03 is statistically significant at a 0.05 level of significance. We reject the null hypothesis and conclude the population means for the treatment conditions to be different.
As a nonparametrictest, the Wilcoxon rank‐sum test featured earlier can be adapted to incorporate paired observations. For our data, we have:
> wilcox.test(treat, control, paired = TRUE) Wilcoxon signed rank test data: treat and control V = 15, p-value = 0.0625 alternative hypothesis: true location shift is not equal to 0
Table 2.9 Randomized Block Design
| Treatment 1 | Treatment 2 | Treatment 3 | |
|---|---|---|---|
| Block 1 | 10 | 9 | 8 |
| Block 2 | 15 | 13 | 12 |
| Block 3 | 20 | 18 | 14 |
| Block 4 | 22 | 17 | 15 |
| Block 5 | 25 | 25 | 24 |
We notice that the obtained p ‐value is somewhat greater for the nonparametric test than for the parametric one. In terms of significance tests, this emphasizes the fact that there is usually a cost to not being able to make parametric assumptions.
2.24 BLOCKING WITH SEVERAL CONDITIONS
We have said that in a blocking design, between treatment conditions we expect the covariance to be unequal to 0. Now, consider a design in which, once again we block, but this time on more than two treatment levels. The layout for such a design is given in Table 2.9.
Now, here is the trick to understanding advanced modeling, including a primary feature of mixed effects modeling. We know that we expect the covariance between treatments to be unequal to 0. This is analogous to what we expected in the simple matched-pairs design. It seems then that a reasonable assumption to make for the data in Table 2.9is that the covariances between treatments are equal, or at minimum, follow some hypothesized correlational structure. In multilevel and hierarchical models, attempts are made to account for the correlation between treatment levels instead of assuming these correlations to equal 0 as is the case for classical between‐subjects designs. In Chapter 6, we elaborate on these ideas when we discuss randomized block and repeated measures models.
Читать дальшеИнтервал:
Закладка:
Похожие книги на «Applied Univariate, Bivariate, and Multivariate Statistics»
Представляем Вашему вниманию похожие книги на «Applied Univariate, Bivariate, and Multivariate Statistics» списком для выбора. Мы отобрали схожую по названию и смыслу литературу в надежде предоставить читателям больше вариантов отыскать новые, интересные, ещё непрочитанные произведения.


Обсуждение, отзывы о книге «Applied Univariate, Bivariate, and Multivariate Statistics» и просто собственные мнения читателей. Оставьте ваши комментарии, напишите, что Вы думаете о произведении, его смысле или главных героях. Укажите что конкретно понравилось, а что нет, и почему Вы так считаете.