Daniel J. Denis - Applied Univariate, Bivariate, and Multivariate Statistics
Здесь есть возможность читать онлайн «Daniel J. Denis - Applied Univariate, Bivariate, and Multivariate Statistics» — ознакомительный отрывок электронной книги совершенно бесплатно, а после прочтения отрывка купить полную версию. В некоторых случаях можно слушать аудио, скачать через торрент в формате fb2 и присутствует краткое содержание. Жанр: unrecognised, на английском языке. Описание произведения, (предисловие) а так же отзывы посетителей доступны на портале библиотеки ЛибКат.

- Название:Applied Univariate, Bivariate, and Multivariate Statistics
- Автор:
- Жанр:
- Год:неизвестен
- ISBN:нет данных
- Рейтинг книги:5 / 5. Голосов: 1
-
Избранное:Добавить в избранное
- Отзывы:
-
Ваша оценка:
Applied Univariate, Bivariate, and Multivariate Statistics: краткое содержание, описание и аннотация
Предлагаем к чтению аннотацию, описание, краткое содержание или предисловие (зависит от того, что написал сам автор книги «Applied Univariate, Bivariate, and Multivariate Statistics»). Если вы не нашли необходимую информацию о книге — напишите в комментариях, мы постараемся отыскать её.
contains an accessible introduction to statistical modeling techniques commonly used in the social and behavioral sciences. The text offers a blend of statistical theory and methodology and reviews both the technical and theoretical aspects of good data analysis.
Featuring applied resources at various levels, the book includes statistical techniques using software packages such as R and SPSS®. To promote a more in-depth interpretation of statistical techniques across the sciences, the book surveys some of the technical arguments underlying formulas and equations. The thoroughly updated edition includes new chapters on nonparametric statistics and multidimensional scaling, and expanded coverage of time series models. The second edition has been designed to be more approachable by minimizing theoretical or technical jargon and maximizing conceptual understanding with easy-to-apply software examples. This important text:
Offers demonstrations of statistical techniques using software packages such as R and SPSS® Contains examples of hypothetical and real data with statistical analyses Provides historical and philosophical insights into many of the techniques used in modern social science Includes a companion website that includes further instructional details, additional data sets, solutions to selected exercises, and multiple programming options Written for students of social and applied sciences,
offers a text to statistical modeling techniques used in social and behavioral sciences.
Applied Univariate, Bivariate, and Multivariate Statistics — читать онлайн ознакомительный отрывок
Ниже представлен текст книги, разбитый по страницам. Система сохранения места последней прочитанной страницы, позволяет с удобством читать онлайн бесплатно книгу «Applied Univariate, Bivariate, and Multivariate Statistics», без необходимости каждый раз заново искать на чём Вы остановились. Поставьте закладку, и сможете в любой момент перейти на страницу, на которой закончили чтение.
Интервал:
Закладка:
A useful analogy for understanding power is to think of a sign on a billboard that reads “ H 0is false.” Are you able to detect such a sign with your current glasses or contact lenses that you are wearing? If not, you lack sufficient power. That is, you lack the sensitivity in your instrument (your reading glasses) to correctly detect the falsity of the null hypothesis, and in doing, be in a position to reject it. Alternatively, if you have 20/20 vision, you will be able to detect the false null with ease, and reject it with confidence. A key point to note here is that if H 0is false, it is false regardless of your ability to detect it, analogous to a virus strain being present but biomedical engineers lacking a powerful enough microscope to see it. If the null is false, the only question that remains is whether or not you will have a powerful enough test to detect its falsity. If the null were not false on the other hand, then regardless of your degree of power, you will not be able to detect its falsity (because it is not false to begin with).
Power is a function of four elements, all of which will be featured in our discussion of the p ‐value toward the conclusion of this chapter:
1 The value hypothesized under the statistical alternative hypothesis, H1. All else equal, a greater distance between H0 and H1 means greater power. Though “distance” in this regard is not a one‐to‐one concept with effect size, the spirit of the two concepts is the same. The greater the scientific effect, the more power you will have to detect that effect. This is true whether we are dealing with mean differences in ANOVA‐type models or testing a null hypothesis of the sort H0 : R2 = 0 in regression. In all such cases, we are seeking to detect a deviation from the null hypothesis.
2 The significance level, or type I error rate (α) at which you set your test. All else equal, a more liberal setting such as 0.05 or 0.10 affords more statistical power than a more conservative setting such as 0.01 or 0.001, for instance. It is easier to detect a false null if you allow yourself more of a risk of committing a type I error. Since we usually want to minimize type I error, we typically want to regard α as fixed at a nominal level (e.g., 0.05 or 0.01) and consider it not amenable to adjustment for the purpose of increasing power. Hence, when it comes to boosting power, researchers usually do not want to “mess with” the type I error rate.
3 Population variability, σ2, often unknown but estimated by s2. All else equal, the greater the variance of objects studied in the population, the less sensitive the statistical test, and the less power you will have. Why is this so? As an analogy, consider a rock thrown into the water. The rock will make a definitive particular “splash” in that it will displace a certain amount of water when it hits the surface. This can be considered to be the “effect size” of the splash. If the water is noisy with wind and waves (i.e., high population variability), it will be difficult to detect the splash. If, on the other hand, the water is calm and serene (i.e., low population variability), you will more easily detect the splash. Either way, the rock made a particular splash of a given size. The magnitude of the splash is the same regardless of whether the waters are calm or turbulent. Whether we can detect the splash or not is in part a function of the variance in the population.
4 Applying this concept to research settings, if you are sampling from “noisy” populations, it is harder to see the effect of your independent variable than if you are sampling from less noisy and thus, less variable, populations. This is why research using lab rats or other equally controllable objects can usually detect effects with relatively few animals in a sample, whereas research studying humans on variables such as intelligence, anxiety, attitudes, etc., usually requires many more subjects in order to detect effects. A good way to boost power is to study populations that have relatively low variability before your treatment is administered. If your treatment works, you will be able to detect its efficacy with fewer subjects than if dealing with a highly variable population. Another approach is to covary out one or two factors that are thought to be related to the dependent variable through a technique such as the analysis of covariance (Keppel and Wickens, 2004), discussed and demonstrated later in the book.
5 Sample size, n. All else equal, the greater the sample size, the greater the statistical power. Boosting sample size is a common strategy for increasing power. Indeed, as will be discussed at the conclusion of this chapter, for any significance test in which there is at least some effect (i.e., some distance between the null and alternative), statistical significance is assured for a large‐enough sample size. Obtaining large samples is a good thing (since after all, the most ideal goal would be to have the actual population), but as sample size increases, the p‐value becomes an increasingly poor indicator or measure of experimental effect. Effect sizes should always be reported alongside any significance test.
2.21.1 Visualizing Power
Figure 2.12, adapted from Bollen (1989), depicts statistical power under competing values for detecting the population parameter θ . Note carefully in the figure that the critical value for the test remains constant as a result of our desire to keep the type I error rate constant. It is the distancefrom θ = 0 to θ = C 1or θ = C 2that determines power (the shaded region in distributions (b) and (c)).
Statistical power matters so long as we have the inferential goal of rejecting null hypotheses. A study that is underpowered risks not being able to reject null hypotheses even if such null hypotheses are in reality false. A failure to reject a null hypothesis under the condition of minimal power could either mean a lack of inferential support for the obtained finding, or it could simply suggest an underpowered (and consequently poorly designed) experiment or study. Ensuring adequate statistical power beforeone engages in a research study or experiment is mandatory (Cohen, 1988).
2.22 POWER ESTIMATION USING R AND G *POWER
To demonstrate the estimation of power using software, we first use pwr.r.test(Champely, 2014) in R to estimate required sample size for a Pearson r correlation coefficient. As an example, we estimate required sample size for a population correlation coefficient of ρ = 0.10 at a significance level set to 0.05, with desired power equal to 0.90. Note that in the code that follows, we purposely leave n empty so R can estimate this figure for us:
> install.packages(“pwr”) > library(pwr) > pwr.r.test(n =, r = .10, sig.level = .05, power = .90) approximate correlation power calculation (arctangh transformation) n = 1046.423 r = 0.1 sig.level = 0.05 power = 0.9 alternative = two.sided 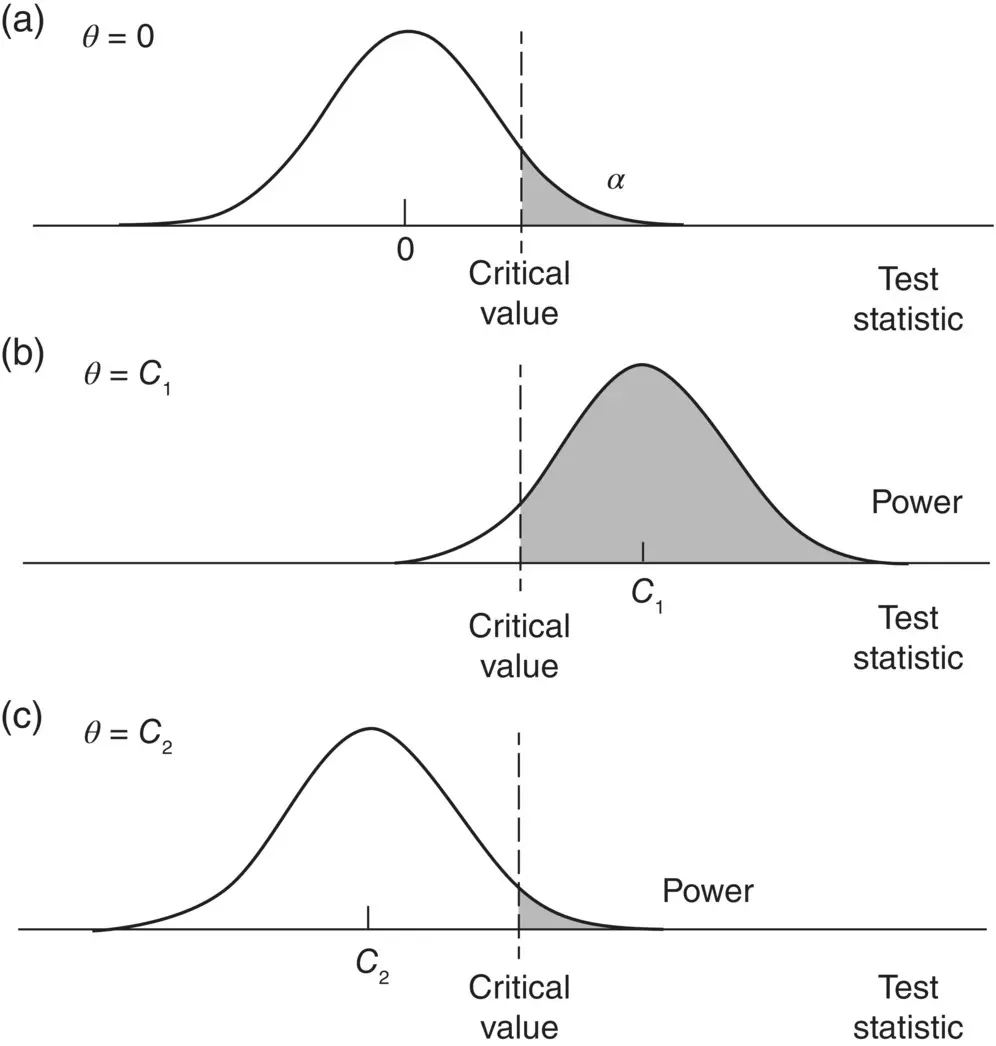
Figure 2.12Power curves for detecting parameters C 1and C 2.
Source: Bollen (1989). Reproduced with permission from John Wiley & Sons, Inc.
We see that to detect a correlation coefficient of 0.10 at a desired level of power equal to 0.9, a sample size of 1046 is required. We could round up to 1047 for a slightly more conservative estimate. It is a more conservative estimate because 1047 is slightly more “generous” of a sample than R is reporting is necessary (1046). Now, in this case, the difference is extremely slight, but in general, when you provide your analysis with more subjects than what may be necessary for a given level of power, you are guarding against the possibility of obtaining smaller effects than what you believe are “out there” in your population. If in doubt, larger samples are always preferable to smaller ones, and thus rounding “up” on sample size requirements is usually a good idea.
Читать дальшеИнтервал:
Закладка:
Похожие книги на «Applied Univariate, Bivariate, and Multivariate Statistics»
Представляем Вашему вниманию похожие книги на «Applied Univariate, Bivariate, and Multivariate Statistics» списком для выбора. Мы отобрали схожую по названию и смыслу литературу в надежде предоставить читателям больше вариантов отыскать новые, интересные, ещё непрочитанные произведения.


Обсуждение, отзывы о книге «Applied Univariate, Bivariate, and Multivariate Statistics» и просто собственные мнения читателей. Оставьте ваши комментарии, напишите, что Вы думаете о произведении, его смысле или главных героях. Укажите что конкретно понравилось, а что нет, и почему Вы так считаете.