Daniel J. Denis - Applied Univariate, Bivariate, and Multivariate Statistics
Здесь есть возможность читать онлайн «Daniel J. Denis - Applied Univariate, Bivariate, and Multivariate Statistics» — ознакомительный отрывок электронной книги совершенно бесплатно, а после прочтения отрывка купить полную версию. В некоторых случаях можно слушать аудио, скачать через торрент в формате fb2 и присутствует краткое содержание. Жанр: unrecognised, на английском языке. Описание произведения, (предисловие) а так же отзывы посетителей доступны на портале библиотеки ЛибКат.

- Название:Applied Univariate, Bivariate, and Multivariate Statistics
- Автор:
- Жанр:
- Год:неизвестен
- ISBN:нет данных
- Рейтинг книги:5 / 5. Голосов: 1
-
Избранное:Добавить в избранное
- Отзывы:
-
Ваша оценка:
Applied Univariate, Bivariate, and Multivariate Statistics: краткое содержание, описание и аннотация
Предлагаем к чтению аннотацию, описание, краткое содержание или предисловие (зависит от того, что написал сам автор книги «Applied Univariate, Bivariate, and Multivariate Statistics»). Если вы не нашли необходимую информацию о книге — напишите в комментариях, мы постараемся отыскать её.
contains an accessible introduction to statistical modeling techniques commonly used in the social and behavioral sciences. The text offers a blend of statistical theory and methodology and reviews both the technical and theoretical aspects of good data analysis.
Featuring applied resources at various levels, the book includes statistical techniques using software packages such as R and SPSS®. To promote a more in-depth interpretation of statistical techniques across the sciences, the book surveys some of the technical arguments underlying formulas and equations. The thoroughly updated edition includes new chapters on nonparametric statistics and multidimensional scaling, and expanded coverage of time series models. The second edition has been designed to be more approachable by minimizing theoretical or technical jargon and maximizing conceptual understanding with easy-to-apply software examples. This important text:
Offers demonstrations of statistical techniques using software packages such as R and SPSS® Contains examples of hypothetical and real data with statistical analyses Provides historical and philosophical insights into many of the techniques used in modern social science Includes a companion website that includes further instructional details, additional data sets, solutions to selected exercises, and multiple programming options Written for students of social and applied sciences,
offers a text to statistical modeling techniques used in social and behavioral sciences.
Applied Univariate, Bivariate, and Multivariate Statistics — читать онлайн ознакомительный отрывок
Ниже представлен текст книги, разбитый по страницам. Система сохранения места последней прочитанной страницы, позволяет с удобством читать онлайн бесплатно книгу «Applied Univariate, Bivariate, and Multivariate Statistics», без необходимости каждый раз заново искать на чём Вы остановились. Поставьте закладку, и сможете в любой момент перейти на страницу, на которой закончили чтение.
Интервал:
Закладка:
Next, SPSS features Item‐Total Statistics, which contains useful information for potentially dropping items and seeking to ameliorate reliability:
| Item‐Total Statistics | |||||
|---|---|---|---|---|---|
| Scale Mean if Item Deleted | Scale Variance if Item Deleted | Corrected Item‐Total Correlation | Squared Multiple Correlation | Cronbach's Alpha if Item Deleted | |
| Item_1 | 34.3000 | 108.900 | 0.712 | 0.726 | 0.478 |
| Item_2 | 32.8000 | 80.400 | 0.558 | 0.841 | 0.476 |
| Item_3 | 32.5000 | 88.278 | 0.512 | 0.448 | 0.507 |
| Item_4 | 32.2000 | 104.844 | 0.796 | 0.776 | 0.445 |
| Item_5 | 34.6000 | 164.267 | −0.228 | 0.541 | 0.824 |
The most relevant column of the above is the last one on the far right, “ Cronbach's Alpha if Item Deleted.” What this reports is how much alpha would change if the given item were excluded. We can see that for all items, alpha would decreaseif the given item were excluded, but for item 5, alpha would increase. If we drop item 5 then, we should expect alpha to increase. We recompute alpha after removing item 5:
RELIABILITY /VARIABLES=Item_1 Item_2 Item_3 Item_4 /SCALE('ALL VARIABLES') ALL /MODEL=ALPHA /STATISTICS=DESCRIPTIVE SCALE CORR /SUMMARY=TOTAL.
| Reliability Statistics | ||
|---|---|---|
| Cronbach's Alpha | Cronbach's Alpha Based on Standardized Items | Not Items |
| 0.824 | 0.863 | 4 |
As we can see, alpha indeed did increase to 0.824 as indicated it would based on our previous output. Hence, according to coefficient alpha, dropping item 5 may be worthwhile in the hopes of improving the instrument and making its items a bit more interrelated.
Though we have provided an easy demonstration of Cronbach's alpha, it would be negligent at this point to not issue a few cautions and caveats regarding its everyday use. According to Green and Yang (2009), the regular employment of coefficient alpha for assessing reliability should be discouraged based on the fact that assumptions for the statistic are rarely ever met, and hence the statistic can exhibit a high degree of bias. What is more, according to a now classic paper by Schmitt (1996), alpha should not be used to conclude anything about unidimensionalityof a test, and thus should not be interpreted as such. Confirmatory factor analysis models( Chapter 15) are typically better suited for assessing and establishing the dimensionality of a set of items. What is more, cut‐offs for alpha regarding what is low versus high internal consistency can be very difficult to define, and as argued by Schmitt, low levels of alpha may still be useful. Hence, though easily computable in SPSS and other software, the reader should be cautious about the unrestricted employment of alpha in their work. For more details on how it should be used, in addition to the aforementioned sources, Cortina (1993) and Miller (1995) are very informative readings and should be read before you readily and regularly adopt alpha in your everyday statistical toolkit.
2.18 COVARIANCE AND CORRELATION MATRICES
Having reviewed the concept of covariance, we need a way to account for the covariance of many variables. For this, we write the sample covariance in matrix form:
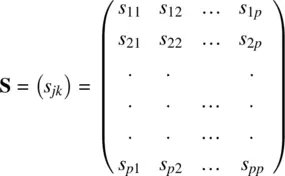
where s jkare the covariances for variables j by k . The population covariance matrix ∑ can be analogously defined:
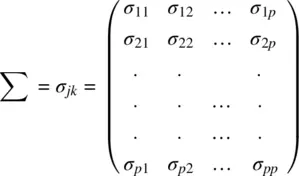
where along the main diagonal of the covariance matrix are variances σ 11, σ 22, etc., for variables 1, 2, etc., up to σ pp, the variance of the p thvariable.
When we standardize the covariance matrix, dividing each of its elements by respective products of standard deviations, we obtain the correlation matrix:
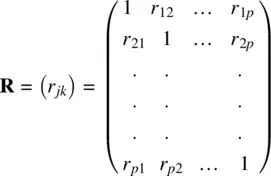
where r 12is the correlation between variables 1 and 2, etc., and r 1pis the correlation between variable 1 and the p thvariable.
An example of a correlation matrix (Heston, 1948) is that between different tests on the GRE ( Graduate Record Examination):
Intercorrelations Among The G.R.E. Tests Of General Education Math P.S. B.S. Soc. Lit. Arts Exp. Voc. Mathematics .55 .44 .51 .36 .35 .52 .38 Physical Science .55 .49 .43 .20 .40 .32 .29 Biological Science .44 .49 .57 .42 .42 .46 .50 Social Studies .51 .43 .57 .54 .40 .61 .59 Literature .36 .20 .42 .54 .39 .53 .54 Arts .35 .40 .42 .40 .39 .42 .52 Effecive Expression .52 .32 .46 .61 .53 .42 .66 Vocabulary .38 .29 .50 .59 .54 .52 .66
From the matrix, we can see that most correlations are low to moderate, with the correlation between Effective Expression and Vocabulary relatively large at a value of 0.66. The correlation between Physical Science and Vocabulary is relatively small, equaling 0.29.
2.19 OTHER CORRELATION COEFFICIENTS
It often happens that once we hear of Pearson's r , this becomes the onlycorrelation coefficient in one's vocabulary, and too often the concept, rather than calculation, of a correlation is automatically linked to Pearson's r . Pearson r is but one of manycorrelation coefficients available at one's disposal in applied research. Recall that Pearson r captures linearrelationships between (typically) continuous variables. If the relationship is not linear, or one or more variables are not continuous, or again if the data are in the form of ranks, then other correlation coefficients are generally more suitable. We briefly review Spearman's rho, although a host of other correlation coefficients exist that are well‐suited for a variety of particular types of data. 8
Spearman's r s(“rho”), named after Charles Spearman who developed the coefficient in 1904, 9 is a correlation coefficient suitable for data on two variables that are expressed in terms of ranksrather than actual measurements on a continuous scale. Mathematically, the Spearman correlation coefficient is equivalent to a Pearson r when the data are ranked. There are important differences between these two coefficients. Spearman's r scan be defined as:
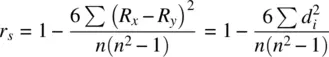
where R xand R yare the ranks on x iand y ifor the i thindividual in the data,  are squared rank deviations, and n is the number of pairs of ranks (Kirk, 2008). When we compute r son the Galton data, we obtain:
> cor.test(parent, child, method = "spearman") Spearman's rank correlation rho data: parent and child S = 76569964, p-value < 2.2e-16 alternative hypothesis: true rho is not equal to 0 sample estimates: rho 0.4251345
Читать дальшеИнтервал:
Закладка:
Похожие книги на «Applied Univariate, Bivariate, and Multivariate Statistics»
Представляем Вашему вниманию похожие книги на «Applied Univariate, Bivariate, and Multivariate Statistics» списком для выбора. Мы отобрали схожую по названию и смыслу литературу в надежде предоставить читателям больше вариантов отыскать новые, интересные, ещё непрочитанные произведения.


Обсуждение, отзывы о книге «Applied Univariate, Bivariate, and Multivariate Statistics» и просто собственные мнения читателей. Оставьте ваши комментарии, напишите, что Вы думаете о произведении, его смысле или главных героях. Укажите что конкретно понравилось, а что нет, и почему Вы так считаете.