Thomas N. Bulkowski - Encyclopedia of Chart Patterns
Здесь есть возможность читать онлайн «Thomas N. Bulkowski - Encyclopedia of Chart Patterns» — ознакомительный отрывок электронной книги совершенно бесплатно, а после прочтения отрывка купить полную версию. В некоторых случаях можно слушать аудио, скачать через торрент в формате fb2 и присутствует краткое содержание. Жанр: unrecognised, на английском языке. Описание произведения, (предисловие) а так же отзывы посетителей доступны на портале библиотеки ЛибКат.

- Название:Encyclopedia of Chart Patterns
- Автор:
- Жанр:
- Год:неизвестен
- ISBN:нет данных
- Рейтинг книги:3 / 5. Голосов: 1
-
Избранное:Добавить в избранное
- Отзывы:
-
Ваша оценка:
Encyclopedia of Chart Patterns: краткое содержание, описание и аннотация
Предлагаем к чтению аннотацию, описание, краткое содержание или предисловие (зависит от того, что написал сам автор книги «Encyclopedia of Chart Patterns»). Если вы не нашли необходимую информацию о книге — напишите в комментариях, мы постараемся отыскать её.
, Third Edition expands upon Bulkowski's immensely popular Second Edition with fully revised and updated material on chart patterns. Whether you’re new to the stock market or an experienced professional trader, use this book as a reference guide to give you an edge.
Within the pages of this book, you’ll learn how to identify chart patterns, supported by easy-to-understand performance statistics describing how well a pattern works, what the failure rate is, and what special quirks suggest better future performance. You’ll discover how often a stop loss order will trigger at various locations within a chart pattern, how the chart pattern’s performance has evolved over the past three decades, and how to profit from failure by trading busted patterns.
This broadened and revised
offers investors the most comprehensive, up-to-date guide to this popular method of market analysis. Written by a leading expert on chart patterns, Tom Bulkowski, this edition includes revised statistics on 75 chart patterns including 23 new ones, with pictures and performance statistics, packaged within easy-to-read text.
Gain essential knowledge of chart patterns and how they are used to predict price movements in bull and bear markets New tables include how often stops are hit, busted pattern performance, performance over the decades, and special pattern features Joining Tour, Identification Guidelines, Focus on Failures, Statistics, Trading Tactics and Sample Trade is Experience. It puts you in the passenger’s seat so you can share lessons learned from Bulkowski's trades This edition reports on statistics from nearly four times the number of samples used in the Second Edition and ten times the number in the , Third Edition further solidifies the reputation of this book as the leading reference on chart patterns, setting it far above the competition.
Encyclopedia of Chart Patterns — читать онлайн ознакомительный отрывок
Ниже представлен текст книги, разбитый по страницам. Система сохранения места последней прочитанной страницы, позволяет с удобством читать онлайн бесплатно книгу «Encyclopedia of Chart Patterns», без необходимости каждый раз заново искать на чём Вы остановились. Поставьте закладку, и сможете в любой момент перейти на страницу, на которой закончили чтение.
Интервал:
Закладка:
As I read this, I see lots of warning signs, especially with the market trending lower. You want to trade with the trend, not try to push against it. However, I bought at the right time because the stock lifted off the runway (at the bottom trendline) and climbed.
The stock threw back and bottomed at the price of the bottom trendline again before making its way up to cruising altitude.
Fast‐forward to June 2000. Price had peaked and had retraced 18% off the high set in early May. Here's my notebook entry for the sale: “27 June 2000. I sold my entire holdings because the stock has pierced the support base of a descending triangle [meaning the triangle had a downward breakout]. With seasonal performance moving up in December and peaking in the spring, I missed the high by about $3/share. Ouch . Oil prices are high, raising fuel costs, and interest rates are still high, maybe moving up more. So, it looks like the excitement is over although today the stock is up almost $1.”
I sold and made 27% on the trade. As good as that sounds, I sold at the day the stock bottomed. After that, it climbed by 89%. Well, spit! This keeps happening if you read about my trades. The day I sell the stock bottoms and makes a substantial rise. It's one of those Catch‐22 scenarios. If I hold on, the stock will continue down. If I sell, it'll double in price, thumbing its nose as I watch from the sidelines.
Lesson: Assess how far price might drop before selling. The trade might be worth holding onto longer if the downside risk is limited.
Hercules Inc.
I wrote about Hercules Inc. (HPC) as a potential pipe bottom trade (weekly scale), but it's also a broadening bottom on the daily scale. Let me tell you how I traded the broadening bottom.
The stock made a nice‐looking broadening bottom in May and June 2007. It included a partial decline that correctly predicted an upward breakout.
Did I take advantage of the partial decline? No. My notes don't tell why, either. I bought the day after an upward breakout. A better move would have had a buy stop placed at the top of the broadening bottom for a more timely and lower‐priced entry. Or I could have bought earlier because of the partial decline (which is more risky).
Here's my notebook: “Buy reason: Broadening bottom and potential pipe bottom. This is also a measured move up pattern [MMU]. The MMU began in August 2006 and peaked in March, corrected to [the] June low, and is now moving up in the second leg.”
If the measure move were to fulfill its promise, I'd make a bundle because the pattern was huge. The first leg rise was 60%. If the second leg was close to the same length, well, I'd be happy.
Additional notes to the trade were skeptical of the measured move working as expected, even after taking half the first leg height and using that as a projection for a target. “Just 45% meet the target so it's likely this will die at the old high [21.40].” Half height target came out to be 21.52, suggesting a stall at the old high.
This was a swing trade, a short‐term one where the potential profit from where I bought wasn't big. I used a volatility‐based stop and raised it four times along the way to 27 July, when I was stopped out. The market dropped 500 points over 2 days, and it pulled the stock down far enough to trigger the stop.
I sold at 20.36 and made just 1% on the trade. That was just 3 trading days after the stock peaked at 22.48. So I got close to a perfect exit.
The stock appeared to make a 2B pattern. Price exceeded the old high of 21.40 by coasting up to 22.48 before moving below 15 in a series of rollercoaster swings. If I had placed an order to sell my shares at the 21.40 target, I'd have done better.
Lesson: A better entry was to have a buy stop set at a penny above the top of the chart pattern and not wait for confirmation. The partial decline correctly signaled an upward breakout, so that would help boost confidence that a lower entry price was the correct choice.
Lesson: For short‐term swing trades, set a limit order to sell at the target price.
Sample Trade
Sharon likes to think of herself as the brains in the family. While her husband is suffering in foul weather as a carpenter, she is hammering away at her keyboard, a slave to her computer masters. She uses profit from her swing trading to build their emergency fund. “Last month I found a pair of Manolo Blahniks.” She sighed. “It was a shoe emergency.” She glanced at me.
My eyebrow ticked up. “A shoe emergency?”
She nodded. “Let me show you…”
We're old friends, so I grabbed her arm. “Stop right there!” I knew that once she started showing me her collection, I'd be there all day.
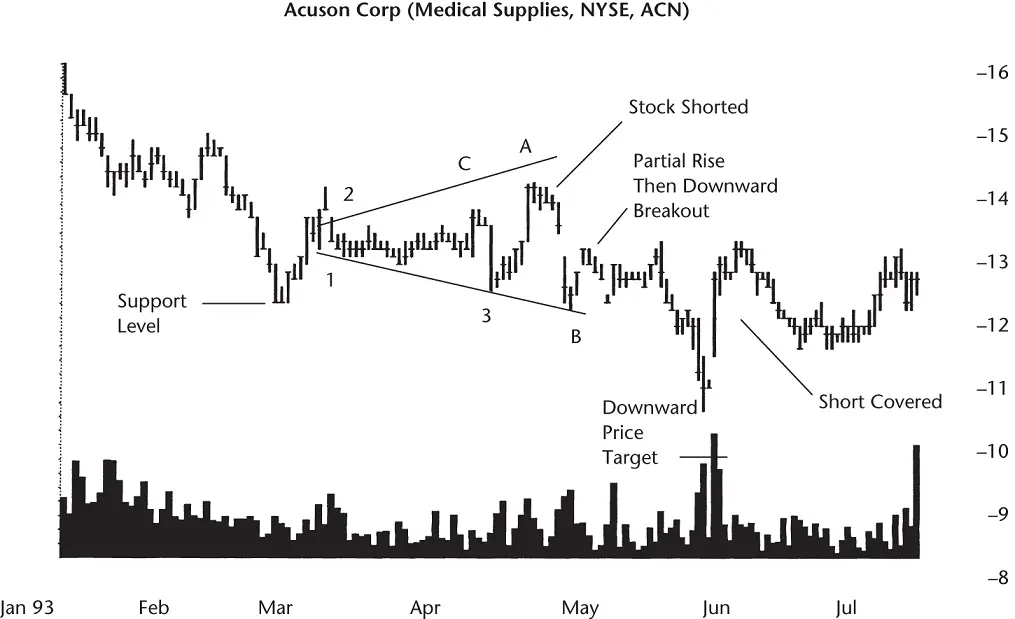
Figure 8.5A broadening bottom with five alternating touches. Expect an immediate downward breakout because a partial rise appears.
Sharon is not afraid to short a stock, given good profit potential and an especially weak fundamental or technical situation. It is a stressful life, but making money often is.
“When I spotted the broadening bottom,” she said (shown in Figure 8.5), “I became interested.”
The stock reached a high of 37.38 in early November 1991 and had been heading down since.
“With the stock trading at 14, I wondered how much downside remained, so I drew the two trendline boundaries and counted the number of alternating touches.” Three are labeled as numbers in the figure and points A and B are the remaining touches.
“Because the stock was near A, heading down, I guessed that it would break out downward on the next cross. I did research to try to prove it, and then I shorted the stock at 13.88. It was a gamble, but one I was comfortable with. I placed a stop at 14.25, just above A.”
She snapped her fingers, “Bingo! Two days later the stock plummeted to the other side of the pattern,” touching the bottom trendline at point B. “Usually my trades aren't that easy. I lowered my stop to 15 cents above C [the nearest minor high], and waited.”
The stock bounced off the lower trendline instead of busting through as she hoped. She decided to be patient and see what the stock did next. With her stop‐loss order in place at the breakeven price, she felt protected and comfortable letting the trade ride.
A partial rise formed before meeting resistance and heading back down. “I believed that when the stock reached the bottom trendline, it would break out downward this time, so I doubled my position.”
She sighed. “I was wrong.”
“It takes a big man to admit that,” I said and winked at her. The stock continued down one more day before easing higher.
“I adjusted my stop‐loss order to include the additional shares, but kept it at the same price [13.75, C]. Then I waited.”
The stock reached a minor high of 13.13 before heading down again. This time the decline was strong enough to punch through support at the lower trendline.
“When the stock dropped below point B toward the end of May, I lowered my stop to 15 cents above B,” or 12.15.
She looked at the measure rule for the price target. She calculated a target of 9.88 and wondered if the stock would really reach that price. To be safe, she decided to cash out if the stock reached 10.15, or 15 cents above the common support price of 10 (a whole number typically shows support and resistance).
“The stock hit 10.38 on high volume. I thought it might be a one‐day reversal.” With those chart patterns, it's difficult to be sure if price would reverse or not. “I decided to hold on and kept my original target in place.”
Читать дальшеИнтервал:
Закладка:
Похожие книги на «Encyclopedia of Chart Patterns»
Представляем Вашему вниманию похожие книги на «Encyclopedia of Chart Patterns» списком для выбора. Мы отобрали схожую по названию и смыслу литературу в надежде предоставить читателям больше вариантов отыскать новые, интересные, ещё непрочитанные произведения.


Обсуждение, отзывы о книге «Encyclopedia of Chart Patterns» и просто собственные мнения читателей. Оставьте ваши комментарии, напишите, что Вы думаете о произведении, его смысле или главных героях. Укажите что конкретно понравилось, а что нет, и почему Вы так считаете.