Thomas N. Bulkowski - Encyclopedia of Chart Patterns
Здесь есть возможность читать онлайн «Thomas N. Bulkowski - Encyclopedia of Chart Patterns» — ознакомительный отрывок электронной книги совершенно бесплатно, а после прочтения отрывка купить полную версию. В некоторых случаях можно слушать аудио, скачать через торрент в формате fb2 и присутствует краткое содержание. Жанр: unrecognised, на английском языке. Описание произведения, (предисловие) а так же отзывы посетителей доступны на портале библиотеки ЛибКат.

- Название:Encyclopedia of Chart Patterns
- Автор:
- Жанр:
- Год:неизвестен
- ISBN:нет данных
- Рейтинг книги:3 / 5. Голосов: 1
-
Избранное:Добавить в избранное
- Отзывы:
-
Ваша оценка:
Encyclopedia of Chart Patterns: краткое содержание, описание и аннотация
Предлагаем к чтению аннотацию, описание, краткое содержание или предисловие (зависит от того, что написал сам автор книги «Encyclopedia of Chart Patterns»). Если вы не нашли необходимую информацию о книге — напишите в комментариях, мы постараемся отыскать её.
, Third Edition expands upon Bulkowski's immensely popular Second Edition with fully revised and updated material on chart patterns. Whether you’re new to the stock market or an experienced professional trader, use this book as a reference guide to give you an edge.
Within the pages of this book, you’ll learn how to identify chart patterns, supported by easy-to-understand performance statistics describing how well a pattern works, what the failure rate is, and what special quirks suggest better future performance. You’ll discover how often a stop loss order will trigger at various locations within a chart pattern, how the chart pattern’s performance has evolved over the past three decades, and how to profit from failure by trading busted patterns.
This broadened and revised
offers investors the most comprehensive, up-to-date guide to this popular method of market analysis. Written by a leading expert on chart patterns, Tom Bulkowski, this edition includes revised statistics on 75 chart patterns including 23 new ones, with pictures and performance statistics, packaged within easy-to-read text.
Gain essential knowledge of chart patterns and how they are used to predict price movements in bull and bear markets New tables include how often stops are hit, busted pattern performance, performance over the decades, and special pattern features Joining Tour, Identification Guidelines, Focus on Failures, Statistics, Trading Tactics and Sample Trade is Experience. It puts you in the passenger’s seat so you can share lessons learned from Bulkowski's trades This edition reports on statistics from nearly four times the number of samples used in the Second Edition and ten times the number in the , Third Edition further solidifies the reputation of this book as the leading reference on chart patterns, setting it far above the competition.
Encyclopedia of Chart Patterns — читать онлайн ознакомительный отрывок
Ниже представлен текст книги, разбитый по страницам. Система сохранения места последней прочитанной страницы, позволяет с удобством читать онлайн бесплатно книгу «Encyclopedia of Chart Patterns», без необходимости каждый раз заново искать на чём Вы остановились. Поставьте закладку, и сможете в любой момент перейти на страницу, на которой закончили чтение.
Интервал:
Закладка:
How do you find an ascending broadening formation? To answer the question, read the selection guidelines outlined in Table 9.1. Microscopes or telescopes are optional. While chewing on the table, look at Figure 9.3, an ascending broadening formation on the weekly scale.
Table 9.1 Identification Guidelines
| Characteristic | Discussion |
|---|---|
| Appearance | Looks like a megaphone with the base of the formation horizontal and bounded on the top by an up‐sloping trendline. |
| Horizontal bottom support line | A horizontal, or nearly so, trendline that connects the minor lows. |
| Up‐sloping top trendline | An up‐sloping trendline bounds the expanding price series on top. |
| Touches | Look for at least five trendline touches, three on one trendline and two on the other. |
| Whitespace | Price should bounce from trendline to trendline, overwriting whitespace from the pattern. |
| Price action before breakout | Price sometimes moves horizontally for many months before moving outside the formation high or low. |
| Breakout direction | Price can break out of the pattern in either direction, but favors an upward breakout. |
| Volume | Trends upward most often. |
| Support and resistance | Follows the two trendlines into the future. |
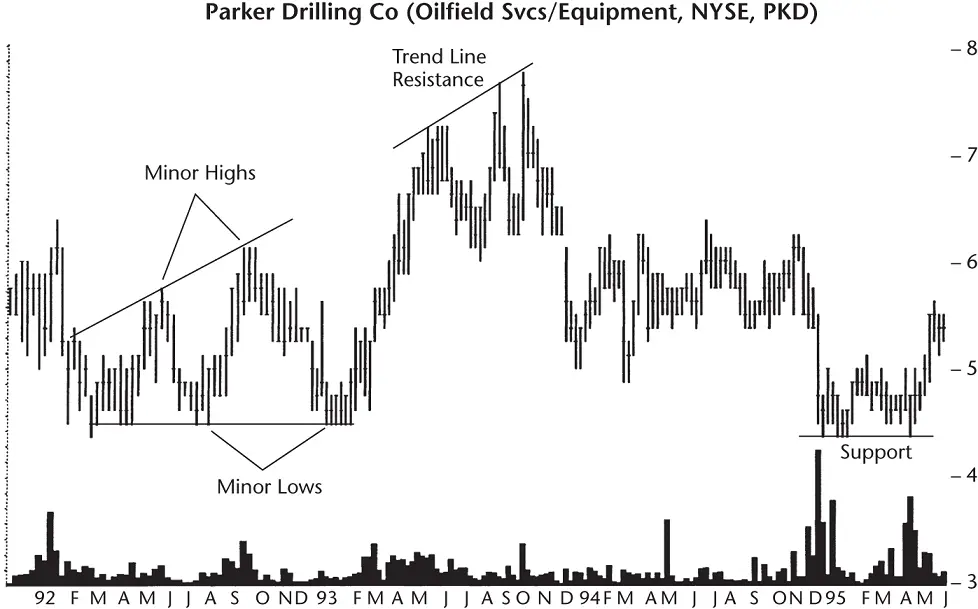
Figure 9.3 Support and resistance areas on a weekly time scale. They appear along the trendline axis and can extend far into the future, as in this case.
Appearance.The overall shape of the formation looks like a megaphone with the bottom of it horizontal.
Horizontal bottom support line.The bottom of the pattern follows a horizontal trendline while an up‐sloping trendline bounds the top. Look for price to come close to or touch the trendline at least twice in distinct minor lows.
Up‐sloping top trendline.Price should touch the top trendline at least twice, in two minor highs.
Touches.Price should come near to or touch each trendline in minor highs or minor lows. At least five touches are needed to qualify the pattern, but be flexible. Don't count it as a touch when price slices through a trendline. That often occurs at the start and breakout from the pattern. If price doesn't touch a trendline at a minor high or minor low, then it doesn't count as a touch.
Whitespace.Price should bounce across the pattern from top to bottom frequently, filling the whitespace with price movement.
Price action before breakout.In some ascending broadening formations, price moves sideways for many months while trying to decide on a breakout direction. Eventually, price rises above the formation top or slides through the bottom trendline and stages a breakout.
Breakout direction.The breakout favors an upward direction, but it's almost random. A breakout occurs when price closes outside the trendline boundary.
Volume.The volume trend is usually upward. Don't discard a chart pattern because volume trends in a direction different from what you expect.
Support and resistance.I chose Figure 9.3because it shows the two common areas of support and resistance. These areas follow the trendlines. Along the base of the formation projected into the future, the support area repels the decline over 2 years after the formation ends. The rising trendline tells a similar tale; it repels price three times nearly a year later.
The implications of this observation are profound. If you own a stock and it is breaking out to new highs, it would be nice to predict how high price may rise. One way to do that is to search for formations such as this one. Many times, extending the trendlines into the future will predict areas of support and resistance.
Although the trendline did not predict the absolute high, it did suggest when price would stall. The resistance area turned out to be a good opportunity to sell the stock.
Focus on Failures
Figure 9.4shows a failure that's typical for most chart patterns: It's called a 5% failure.
Price bounces between the two trendlines plenty of times, forming a right‐angled and ascending broadening formation, A. Price along the bottom sometimes pierces the horizontal support line (B) and sometimes it falls short. It's close enough, though, to give us enough minor low touches.
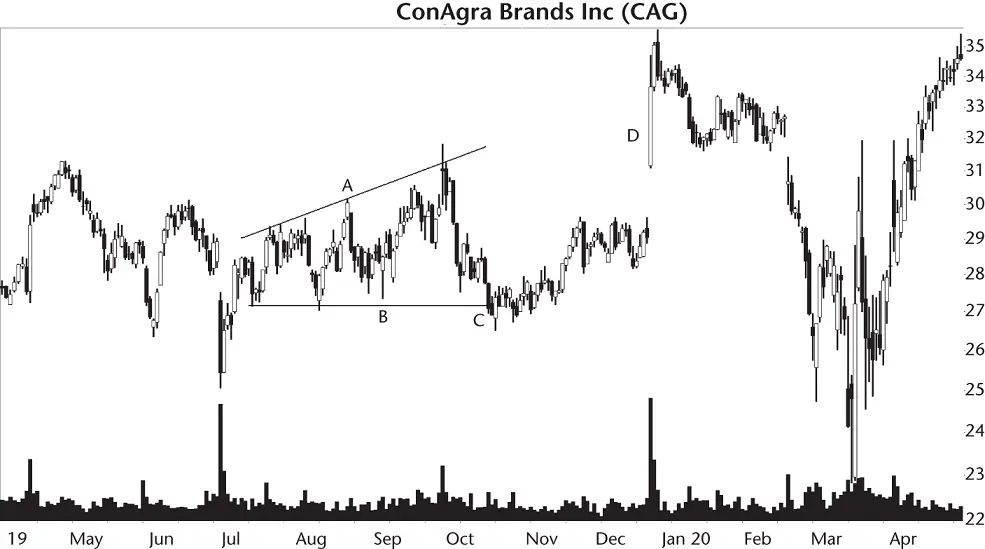
Figure 9.4 The broadening formation breaks out downward, but the stock fails to see price drop far.
Depending on how you draw the horizontal line along the bottom of the chart pattern, the breakout happens at C when the stock closes below the line.
Price makes a lower low before recovering. It's like dipping your toe into water (just after the breakout), finding it too cold for a swim, and scurrying back indoors (when price rises). Price busts the downward breakout at D when a breakaway gap sends price soaring.
Unfortunately, these types of failures happen too often in chart patterns. If you own the stock and it fails to drop more than 5%, then you're in good shape. If you sell a long holding expecting a big decline and it fails to provide one, you might be upset. Chill out. You'll never get out of this life alive.
I don't know of many tips to share that limit these types of failures. One tip is to look at the market trend. If the general market is trending higher, that's a plus. If it's moving sideways, I can live with that, too, but know the ride might be bumpy. A downward trend spells trouble. Do I really want to swim against the current and risk being run over by a jet skier?
I do the same check for stocks in the industry. I count how many are rising over the past 6 months. If I follow a dozen stocks in the industry and nine of them are rising, then that's good. Too many trending lower could spell a problem for a bullish trade.
Finally, after checking the general market and checking the industry health, I'll look at the stock. On the weekly or monthly scale, if the stock has been trending lower for years, then I won't buy it. If it's been making new highs, trending upward in a nice 30‐ to 45‐degree slope, then I feel reassured that the uptrend will continue. That's a momentum play.
Ask yourself this: How long will the uptrend continue? Is buying now closer to the start of the trend or the end? Of course, we won't know for sure until much later, but I want to avoid uptrends that end just after I buy. When that happens, it really pisses me off.
On a shorter‐term scale, look for overhead resistance and underlying support to help gauge where the stock might reverse.
Statistics
Table 9.2shows general statistics for this chart pattern.
Number of formations.I found 1,223 patterns in stock data from July 1991 to October 2019 in 703 stocks. However, after slicing‐and‐dicing the bear market samples, there were too few to present here. So the following tables only show bull market statistics. Not all stocks covered the entire range, and some no longer trade.
Reversal (R), continuation (C) occurrence.Because the inbound price trend can come from any direction, we can't claim this pattern is a bottom or a top. But we can compare the inbound trend with the direction after the breakout. If the two are in the same direction, then the pattern acts as a continuation of the prevailing price trend.
Читать дальшеИнтервал:
Закладка:
Похожие книги на «Encyclopedia of Chart Patterns»
Представляем Вашему вниманию похожие книги на «Encyclopedia of Chart Patterns» списком для выбора. Мы отобрали схожую по названию и смыслу литературу в надежде предоставить читателям больше вариантов отыскать новые, интересные, ещё непрочитанные произведения.


Обсуждение, отзывы о книге «Encyclopedia of Chart Patterns» и просто собственные мнения читателей. Оставьте ваши комментарии, напишите, что Вы думаете о произведении, его смысле или главных героях. Укажите что конкретно понравилось, а что нет, и почему Вы так считаете.