Thomas N. Bulkowski - Encyclopedia of Chart Patterns
Здесь есть возможность читать онлайн «Thomas N. Bulkowski - Encyclopedia of Chart Patterns» — ознакомительный отрывок электронной книги совершенно бесплатно, а после прочтения отрывка купить полную версию. В некоторых случаях можно слушать аудио, скачать через торрент в формате fb2 и присутствует краткое содержание. Жанр: unrecognised, на английском языке. Описание произведения, (предисловие) а так же отзывы посетителей доступны на портале библиотеки ЛибКат.

- Название:Encyclopedia of Chart Patterns
- Автор:
- Жанр:
- Год:неизвестен
- ISBN:нет данных
- Рейтинг книги:3 / 5. Голосов: 1
-
Избранное:Добавить в избранное
- Отзывы:
-
Ваша оценка:
Encyclopedia of Chart Patterns: краткое содержание, описание и аннотация
Предлагаем к чтению аннотацию, описание, краткое содержание или предисловие (зависит от того, что написал сам автор книги «Encyclopedia of Chart Patterns»). Если вы не нашли необходимую информацию о книге — напишите в комментариях, мы постараемся отыскать её.
, Third Edition expands upon Bulkowski's immensely popular Second Edition with fully revised and updated material on chart patterns. Whether you’re new to the stock market or an experienced professional trader, use this book as a reference guide to give you an edge.
Within the pages of this book, you’ll learn how to identify chart patterns, supported by easy-to-understand performance statistics describing how well a pattern works, what the failure rate is, and what special quirks suggest better future performance. You’ll discover how often a stop loss order will trigger at various locations within a chart pattern, how the chart pattern’s performance has evolved over the past three decades, and how to profit from failure by trading busted patterns.
This broadened and revised
offers investors the most comprehensive, up-to-date guide to this popular method of market analysis. Written by a leading expert on chart patterns, Tom Bulkowski, this edition includes revised statistics on 75 chart patterns including 23 new ones, with pictures and performance statistics, packaged within easy-to-read text.
Gain essential knowledge of chart patterns and how they are used to predict price movements in bull and bear markets New tables include how often stops are hit, busted pattern performance, performance over the decades, and special pattern features Joining Tour, Identification Guidelines, Focus on Failures, Statistics, Trading Tactics and Sample Trade is Experience. It puts you in the passenger’s seat so you can share lessons learned from Bulkowski's trades This edition reports on statistics from nearly four times the number of samples used in the Second Edition and ten times the number in the , Third Edition further solidifies the reputation of this book as the leading reference on chart patterns, setting it far above the competition.
Encyclopedia of Chart Patterns — читать онлайн ознакомительный отрывок
Ниже представлен текст книги, разбитый по страницам. Система сохранения места последней прочитанной страницы, позволяет с удобством читать онлайн бесплатно книгу «Encyclopedia of Chart Patterns», без необходимости каждый раз заново искать на чём Вы остановились. Поставьте закладку, и сможете в любой момент перейти на страницу, на которой закончили чтение.
Интервал:
Закладка:
She pointed at the screen, “Two days later, the stock zipped higher and tagged my stop. I made only 9% and moved the profit into our emergency fund.”
She looked at her watch and gasped. “There's a shoe store having a liquidation sale in twenty minutes. They sell Jimmy Choos. I have to go.” She raced out of the room.
9 Broadening Formation, Right‐Angled and Ascending
RESULTS SNAPSHOT
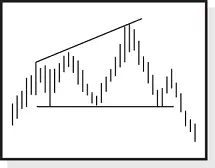
Appearance: A chart pattern with a horizontal (or near‐horizontal) bottom and up‐sloping top.
Upward Breakouts
| Reversal or continuation | Long‐term bullish continuation |
| Performance rank | 18 out of 39 |
| Breakeven failure rate | 15% |
| Average rise | 43% |
| Volume trend | Upward |
| Throwbacks | 68% |
| Percentage meeting price target | 67% |
Downward Breakouts
| Reversal or continuation | Short‐term bearish reversal |
| Performance rank | 25 out of 36 |
| Breakeven failure rate | 28% |
| Average drop | 14% |
| Volume trend | Upward |
| Pullbacks | 63% |
| Percentage meeting price target | 40% |
Before I began studying this chart pattern, I assumed price would climb away from it, simply because the word ascending was in the title. However, I believe the title refers to how the top of the pattern sees price trending upward, bouncing off a flat base.
The pattern is a mid‐list performer, based on the rank. Even the breakeven failure rates are mid‐list (not shown in the above Results Snapshot). They are within a point of the performance rank. Volume trends upward in the pattern, and I find that unusual when compared to other chart pattern types.
Throwbacks and pullbacks happen about twice in every three trades, so don't be fooled if the stock returns to the breakout price within a week or so.
The percentage meeting the price target, at 67% for upward breakouts, is much higher than the 40% rate for downward breakouts, but that's typical. A downward breakout is fighting against a rising general market, so you'd expect the stock to drown.
Let's take a tour to see what this pattern looks like.
Tour
Figure 9.1puts the formation in perspective. There are two right‐angled broadening patterns shown in the chart. The left one is somewhat ill‐formed but better performing than the right. Both chart patterns have a base outlined by a horizontal trendline connecting the minor lows. The up‐sloping trendline skirts the tops of the minor highs. The result is a triangle‐appearing pattern with prices that broaden out. Both of these patterns have downward breakouts, but the breakout could have been upward, too. In fact, upward breakouts are favored (slightly).
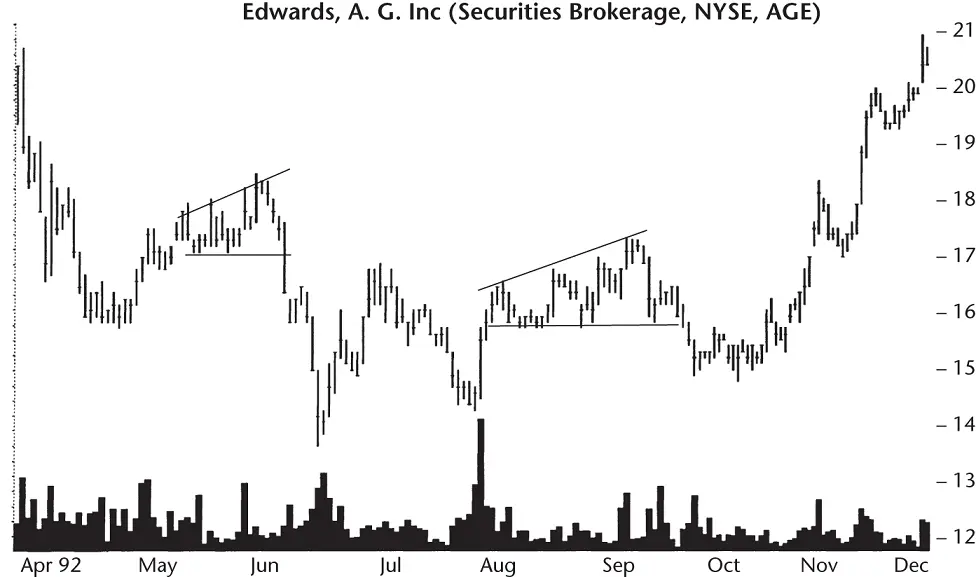
Figure 9.1 Two right‐angled ascending broadening formations bounded by a horizontal base and up‐sloping trendline. Price declines after a downward breakout.
Why do right‐angled ascending broadening formations form? Consider Figure 9.2. The rise began in mid‐December 1991 on volume that was higher than anything seen in the stock for almost 2 months. By late February, the stock had reached a new high and was rounding over after meeting selling resistance at 14. The stock returned to 12.25 where it found support. At that point, it paused for about 2 weeks and established the base on which a trader could start to draw a horizontal trendline.
The reason for the horizontal trendline is one of perceived value. As the stock approached the $12 level, more investors and institutional holders purchased the stock. The desire to own the stock at what they believed a good value outweighed the reluctance of sellers to part with their shares. The buying demand halted the decline in the stock and eventually sent price skyward again. This happened in mid‐April as volume spiked along with price. The buying enthusiasm caused the stock to reach a new high.
Momentum was high enough so that the next day, price rose even further before closing lower. With the second peak, a tentative trendline drawn along the tops of the formation sloped upward and gave character to the broadening formation.
The stock moved rapidly back down even as volume increased. This decline stopped before it reached the lower trendline, signaling continued buying pressure. Price pushed higher and reached a new high, this one at 15.50 on 6 May. The up‐sloping trendline resistance area repelled any further advance (or so I like to think). The stock simply did not have enough upward momentum to push through the selling pressure at the new level.
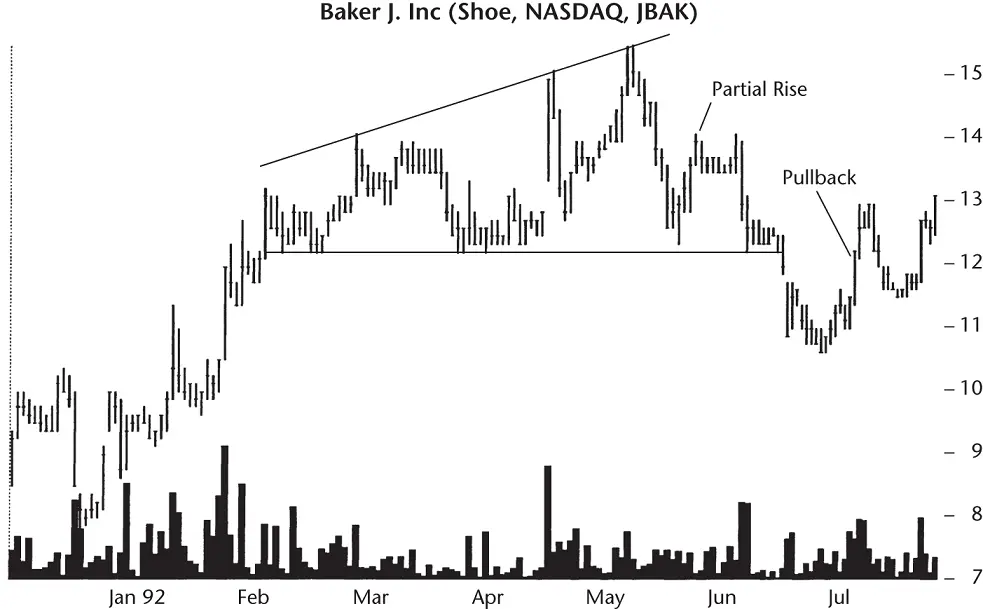
Figure 9.2 Price pulls back to the base of the formation. Pullbacks occur often in ascending broadening formations.
The next day volume dried up, but there was enough momentum remaining for another try at the summit. When the attempt failed, the smart money headed back to base camp and volume receded further. As price collapsed, other investors joined in the retreat and volume moved up. In less than 2 weeks, price was back at the lower trendline.
Another feeble attempt at a new high floundered on unremarkable volume. The stock moved horizontally and stalled out—a partial rise that often spells trouble for bulls. On 4 June, price dropped on high volume and returned to the horizontal trendline. The stock paused there for just over a week before moving down and punching through the support level at 12.25.
A pullback in bull markets is quite common for ascending broadening formations, so it is no surprise that after a rapid 13% retreat, the stock turned around and pulled back to the base of the pattern. Although not shown in the figure, the stock continued moving upward until it began forming another ascending broadening pattern in late October with a base at 16.50.
The ascending broadening formation represents the desire of investors and traders to own the stock at a fixed price, in this case about 12.25. Their buying enthusiasm pushes price higher until mounting selling pressure causes a halt to the rise and sends the stock tumbling. With each attempt, fewer people are left willing to sell their shares until they receive an even higher price, so a broadening range of prices appears at the top.
Eventually, the buying enthusiasm at the base of the pattern collapses and removes the support for the stock. A downward breakout occurs when the stock punches through the support level and declines. It continues moving down until reaching a point where other investors perceive significant value and buy the stock.
Upward breakouts see price continue the fight with the bulls overwhelming the bears. Sometimes, the stock will bump up against overhead resistance set up by extending the top trendline from the broadening pattern. It's as if the bulls know there's a turn coming (at the extended trendline), so they back off and let selling pressure take the stock down again.
Identification Guidelines
Интервал:
Закладка:
Похожие книги на «Encyclopedia of Chart Patterns»
Представляем Вашему вниманию похожие книги на «Encyclopedia of Chart Patterns» списком для выбора. Мы отобрали схожую по названию и смыслу литературу в надежде предоставить читателям больше вариантов отыскать новые, интересные, ещё непрочитанные произведения.


Обсуждение, отзывы о книге «Encyclopedia of Chart Patterns» и просто собственные мнения читателей. Оставьте ваши комментарии, напишите, что Вы думаете о произведении, его смысле или главных героях. Укажите что конкретно понравилось, а что нет, и почему Вы так считаете.