Thomas N. Bulkowski - Encyclopedia of Chart Patterns
Здесь есть возможность читать онлайн «Thomas N. Bulkowski - Encyclopedia of Chart Patterns» — ознакомительный отрывок электронной книги совершенно бесплатно, а после прочтения отрывка купить полную версию. В некоторых случаях можно слушать аудио, скачать через торрент в формате fb2 и присутствует краткое содержание. Жанр: unrecognised, на английском языке. Описание произведения, (предисловие) а так же отзывы посетителей доступны на портале библиотеки ЛибКат.

- Название:Encyclopedia of Chart Patterns
- Автор:
- Жанр:
- Год:неизвестен
- ISBN:нет данных
- Рейтинг книги:3 / 5. Голосов: 1
-
Избранное:Добавить в избранное
- Отзывы:
-
Ваша оценка:
Encyclopedia of Chart Patterns: краткое содержание, описание и аннотация
Предлагаем к чтению аннотацию, описание, краткое содержание или предисловие (зависит от того, что написал сам автор книги «Encyclopedia of Chart Patterns»). Если вы не нашли необходимую информацию о книге — напишите в комментариях, мы постараемся отыскать её.
, Third Edition expands upon Bulkowski's immensely popular Second Edition with fully revised and updated material on chart patterns. Whether you’re new to the stock market or an experienced professional trader, use this book as a reference guide to give you an edge.
Within the pages of this book, you’ll learn how to identify chart patterns, supported by easy-to-understand performance statistics describing how well a pattern works, what the failure rate is, and what special quirks suggest better future performance. You’ll discover how often a stop loss order will trigger at various locations within a chart pattern, how the chart pattern’s performance has evolved over the past three decades, and how to profit from failure by trading busted patterns.
This broadened and revised
offers investors the most comprehensive, up-to-date guide to this popular method of market analysis. Written by a leading expert on chart patterns, Tom Bulkowski, this edition includes revised statistics on 75 chart patterns including 23 new ones, with pictures and performance statistics, packaged within easy-to-read text.
Gain essential knowledge of chart patterns and how they are used to predict price movements in bull and bear markets New tables include how often stops are hit, busted pattern performance, performance over the decades, and special pattern features Joining Tour, Identification Guidelines, Focus on Failures, Statistics, Trading Tactics and Sample Trade is Experience. It puts you in the passenger’s seat so you can share lessons learned from Bulkowski's trades This edition reports on statistics from nearly four times the number of samples used in the Second Edition and ten times the number in the , Third Edition further solidifies the reputation of this book as the leading reference on chart patterns, setting it far above the competition.
Encyclopedia of Chart Patterns — читать онлайн ознакомительный отрывок
Ниже представлен текст книги, разбитый по страницам. Система сохранения места последней прочитанной страницы, позволяет с удобством читать онлайн бесплатно книгу «Encyclopedia of Chart Patterns», без необходимости каждый раз заново искать на чём Вы остановились. Поставьте закладку, и сможете в любой момент перейти на страницу, на которой закончили чтение.
Интервал:
Закладка:
Focus on Failures
Figure 8.4shows a typical broadening bottom failure. Price trended down from the March high. On 19 March (E), the company announced the pricing of a secondary public offering of nearly 8 million shares of common stock. The stock price took a hit and shares tumbled that day and the next, just before the start of the broadening bottom.
The broadening bottom formed innocently enough with price swinging from low to high (A). Price touched the top trendline three times and the bottom trendline three times, as one would expect in a well‐behaved broadening bottom (meaning at least 5 touches).
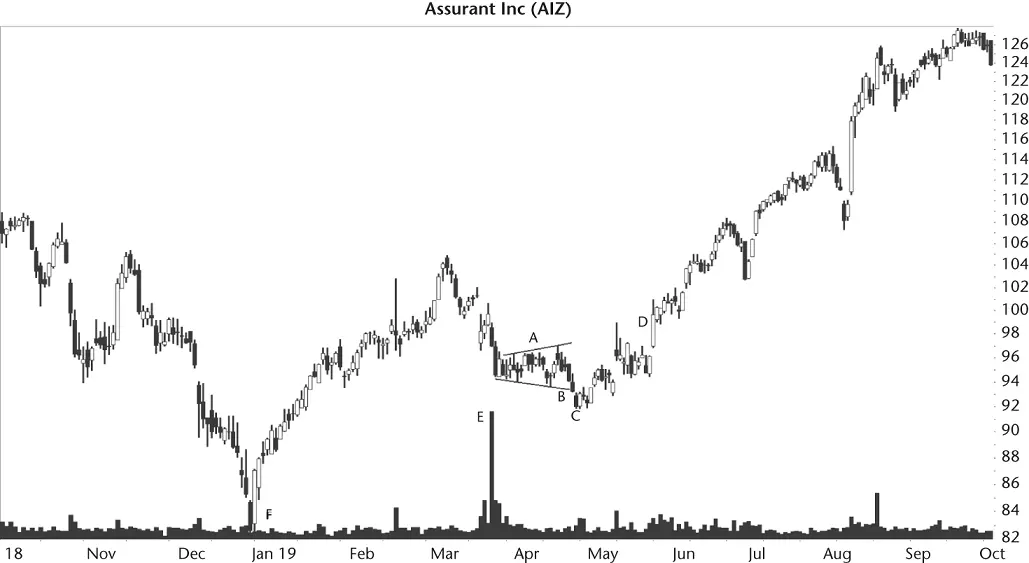
Figure 8.4 This broadening bottom breaks out downward, reverses, and busts the downward breakout.
At B, the stock broke out downward from the broadening pattern when price closed below the lower trendline. Because price trended downward going into the pattern, a trader might expect a downward breakout, too (so the pattern acted as a continuation of the downward price trend). Indeed, they might expect price to drop back to just above the December 2018 low (F).
However, the stock surprised traders when it stalled at C. It was even more of a shock when the stock began to stair‐step higher and closed above the top of the pattern at D. At D, the stock busted the downward breakout. After that, the stock was an airline taking off and flying into the clouds.
The behavior of the broadening pattern shown in the figure represents what I call a 5% failure. Price breaks out lower but fails to continue moving in the breakout direction by more than 5% before heading back up. The reverse is also true for upward 5% failures: Price climbs after an upward breakout by no more than 5% before tumbling.
Statistics
Table 8.2shows general statistics for the broadening bottom chart pattern.
Number found.I dug up 1,238 patterns in 667 stocks starting from August 1991 to September 2019 but removed the bear market ones because they were too few when sorted by breakout direction. Not all stocks covered the entire range, and some no longer trade. Both up and down breakouts are for bull markets.
Reversal (R), continuation (C) occurrence.By definition, a bottoming pattern has price entering the pattern from the top. A pattern acting as a reversal sends price out of the pattern upward (reversing the downtrend). A continuation pattern breaks out downward (continuing the downtrend).
Average rise or decline.Price posts a 45% rise after an upward breakout, helped along by a bullish general market. Downward breakouts suffer when price tries to drop in a bullish market. That's like swimming against the current.
Table 8.2 General Statistics
| Description | Up Breakout | Down Breakout |
|---|---|---|
| Number found | 599 | 405 |
| Reversal (R), continuation (C) occurrence | 100% R | 100% C |
| Average rise or decline | 45% | –15% |
| Standard & Poor's 500 change | 14% | –2% |
| Days to ultimate high or low | 240 | 47 |
| How many change trend? | 52% | 29% |
Standard & Poor's 500 change.The performance of the index can't compare to the performance posted by the chart pattern. That's typical, but I'm not sure it's a fair comparison. We're comparing a perfect trade to the index, using the same dates as the broadening bottom trade. It does show that broadening bottoms can beat the indices, and it also shows that the general market helps performance.
Days to ultimate high or low.This is a measure of how long price takes to reach the ultimate high or low (after the breakout). For upward breakouts, it'll take about 8 months of worry to reach the ultimate high. Downward breakouts take about 6 weeks to drop 15%.
If you compare the ratio of 45% in 240 days to 15% in 80 days, we discover that price drops nearly twice as fast as it rises. That might be a hint for options traders. You might be able to reach your price target faster during a downtrend than an uptrend.
How many change trend?Over half of broadening bottoms with upward breakouts see price rise more than 20% after the breakout (which is good). Downward breakouts suffer, with only 29% dropping more than 20%. The best patterns see price forming strong and lasting trends.
Table 8.3shows failure rates. How do you measure failure? It took a while before I was able to answer that. I measured the move from the breakout price to the ultimate high or low and sorted the results into bins. Then I counted how many entries I had in each bin. It's like sorting coins you found under the seat cushions into piles of dimes, nickels, and quarters, and then counting how many dimes you found, and how many nickels, and so on.
If the breakeven cost of trading is 5%, then we see that 16% of the patterns with upward breakouts will fail to see price rise more than 5%. Downward breakouts are worse, with 26% of them failing to drop more than 5%.
Notice how the failure rates climb. Almost half (46%) of downward breakouts see price drop no more than 10%. Ouch .
Table 8.3 Cumulative Failure Rates
| Maximum Price Rise or Decline (%) | Up Breakout | Down Breakout |
|---|---|---|
| 5 (breakeven) | 98 or 16% | 106 or 26% |
| 10 | 71 or 28% | 80 or 46% |
| 15 | 60 or 38% | 67 or 62% |
| 20 | 56 or 48% | 36 or 71% |
| 25 | 33 or 53% | 34 or 80% |
| 30 | 34 or 59% | 25 or 86% |
| 35 | 26 or 63% | 26 or 93% |
| 50 | 55 or 72% | 27 or 99% |
| 75 | 68 or 84% | 4 or 100% |
| Over 75 | 98 or 100% | 0 or 100% |
What does this mean? Trading chart patterns and expecting a huge gain is unrealistic. Large gains happen, sure, but you might want to invest for the long term (buy and hold) or stick to swing trading and nibble off what you can. Keep your expectations realistic.
Table 8.4shows breakout‐related statistics.
Breakout direction.This just in: Broadening bottoms break out upward more often than downward!
Yearly position, performance.I sorted the breakout price into one of three bins, depending on where it was in the yearly high–low price range. The best performance came when the breakout price was near the yearly low. The worst was when it was near the yearly high. That suggests bottom fishing (buy low, sell high) works better for the broadening bottoms than momentum trading (buy high, sell higher).
Throwbacks and pullbacks.The next several rows in the table dissect throwbacks and pullbacks. If you don't know what a throwback or pullback is, ask your mom (or check the Glossary).
Throwbacks happen 69% of the time. Price breaks out upward from a broadening bottom, rises for a week by an average of 6%, and then returns to (or comes close to) the breakout price by day 12.
If you're an experienced swing trader, you might want to short a downward breakout and close the position in a week or when price drops 7%. However, the median decline is just 5%, so it might not be worth it.
Table 8.4 Breakout and Post‐Breakout Statistics
| Description | Up Breakout | Down Breakout |
|---|---|---|
| Breakout direction | 60% up | 40% down |
| Performance of breakouts occurring near the 12‐month low (L), middle (M), or high (H) | L 48%, M 45%, H 43% | L –16%, M –13%, H –11% |
| Throwbacks/pullbacks occurrence | 69% | 62% |
| Average time to throwback/pullback peaks | 6% in 7 days | –7% in 7 days |
| Average time to throwback/pullback ends | 12 days | 12 days |
| Average rise/decline for patterns with throwbacks/pullbacks | 43% | –14% |
| Average rise/decline for patterns without throwbacks/pullbacks | 48% | –16% |
| Percentage price resumes trend | 75% | 49% |
| Performance with breakout day gap | 48% | –14% |
| Performance without breakout day gap | 44% | –15% |
| Average gap size | $0.63 | $0.74 |
Anyway, I compared the performance of broadening bottoms with and without throwbacks or pullbacks and found that the pattern performs better without a throwback or pullback happening. That's not a surprise because I've seen that behavior in other chart patterns, too.
Читать дальшеИнтервал:
Закладка:
Похожие книги на «Encyclopedia of Chart Patterns»
Представляем Вашему вниманию похожие книги на «Encyclopedia of Chart Patterns» списком для выбора. Мы отобрали схожую по названию и смыслу литературу в надежде предоставить читателям больше вариантов отыскать новые, интересные, ещё непрочитанные произведения.


Обсуждение, отзывы о книге «Encyclopedia of Chart Patterns» и просто собственные мнения читателей. Оставьте ваши комментарии, напишите, что Вы думаете о произведении, его смысле или главных героях. Укажите что конкретно понравилось, а что нет, и почему Вы так считаете.