Thomas N. Bulkowski - Encyclopedia of Chart Patterns
Здесь есть возможность читать онлайн «Thomas N. Bulkowski - Encyclopedia of Chart Patterns» — ознакомительный отрывок электронной книги совершенно бесплатно, а после прочтения отрывка купить полную версию. В некоторых случаях можно слушать аудио, скачать через торрент в формате fb2 и присутствует краткое содержание. Жанр: unrecognised, на английском языке. Описание произведения, (предисловие) а так же отзывы посетителей доступны на портале библиотеки ЛибКат.

- Название:Encyclopedia of Chart Patterns
- Автор:
- Жанр:
- Год:неизвестен
- ISBN:нет данных
- Рейтинг книги:3 / 5. Голосов: 1
-
Избранное:Добавить в избранное
- Отзывы:
-
Ваша оценка:
Encyclopedia of Chart Patterns: краткое содержание, описание и аннотация
Предлагаем к чтению аннотацию, описание, краткое содержание или предисловие (зависит от того, что написал сам автор книги «Encyclopedia of Chart Patterns»). Если вы не нашли необходимую информацию о книге — напишите в комментариях, мы постараемся отыскать её.
, Third Edition expands upon Bulkowski's immensely popular Second Edition with fully revised and updated material on chart patterns. Whether you’re new to the stock market or an experienced professional trader, use this book as a reference guide to give you an edge.
Within the pages of this book, you’ll learn how to identify chart patterns, supported by easy-to-understand performance statistics describing how well a pattern works, what the failure rate is, and what special quirks suggest better future performance. You’ll discover how often a stop loss order will trigger at various locations within a chart pattern, how the chart pattern’s performance has evolved over the past three decades, and how to profit from failure by trading busted patterns.
This broadened and revised
offers investors the most comprehensive, up-to-date guide to this popular method of market analysis. Written by a leading expert on chart patterns, Tom Bulkowski, this edition includes revised statistics on 75 chart patterns including 23 new ones, with pictures and performance statistics, packaged within easy-to-read text.
Gain essential knowledge of chart patterns and how they are used to predict price movements in bull and bear markets New tables include how often stops are hit, busted pattern performance, performance over the decades, and special pattern features Joining Tour, Identification Guidelines, Focus on Failures, Statistics, Trading Tactics and Sample Trade is Experience. It puts you in the passenger’s seat so you can share lessons learned from Bulkowski's trades This edition reports on statistics from nearly four times the number of samples used in the Second Edition and ten times the number in the , Third Edition further solidifies the reputation of this book as the leading reference on chart patterns, setting it far above the competition.
Encyclopedia of Chart Patterns — читать онлайн ознакомительный отрывок
Ниже представлен текст книги, разбитый по страницам. Система сохранения места последней прочитанной страницы, позволяет с удобством читать онлайн бесплатно книгу «Encyclopedia of Chart Patterns», без необходимости каждый раз заново искать на чём Вы остановились. Поставьте закладку, и сможете в любой момент перейти на страницу, на которой закончили чтение.
Интервал:
Закладка:
Sara Lee Corp.
Sara Lee Corp. (SLE) in September 2008 was another buy into a big W that didn't confirm. I lost 4% on that trade when the stock hit my stop and continued lower in the 2007–2009 bear market.
Lesson: If premature breakouts are a concern, wait for confirmation before entering a trade.
Swift Transportation Co.
In Swift Transportation Co. (SWFT), I played the big W differently. I bought when price returned to the launch price, expecting a strong move higher as oil prices were trending downward: “Sell reason: The stock has made a large down move today, following the market lower and others in the industry [are] down. I believe this will move lower, forming a handle to the big W.”
A handle did form, and I sold in the early part of that development at 19.25, for a loss of 8%. I watched from the sidelines as price climbed to 33.66. I missed out on a potential gain of 75%. Sigh .
Again, I picked the right stock, but it took me out when it formed a handle before making a strong push higher.
I don't have a lesson to share except the idea of riding price higher after it reaches the launch price might have merit. Test it to be sure it can work for you and your markets.
Sample Trade
Figure 7.4shows this chapter's sample trade with the big W located at AC. Before I discuss the trade, let's apply the measure rule to this pattern.
The measure rule uses the height of the big W. The peak (B) between the two bottoms has a high price of 12.66. The lower of the two bottoms is C, at 11.27, for a height of 12.66 – 11.27 or 1.39. Add the height to the price at the peak (C) and you get a target of 12.66 + 1.39 or 14.05. Price will reach the target 74% of the time in bull markets, according to Table 7.10. If you want a closer target, take half the height and use that. Thus, a closer target becomes 12.66 + 1.39/2, or 13.36. Price reaches the half‐height target 88% of the time.
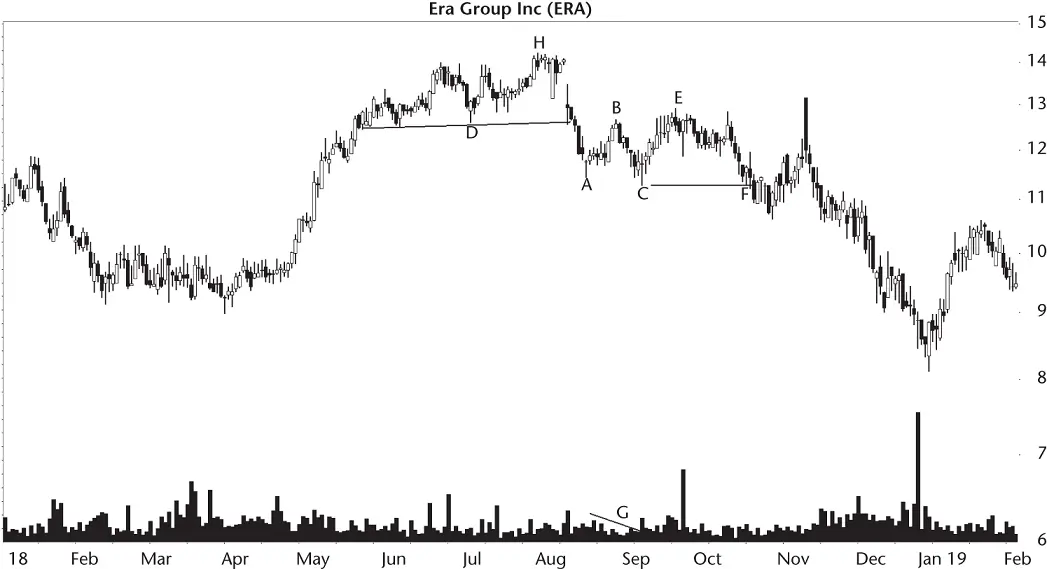
Figure 7.4 John decided not to trade this big W because of overhead resistance.
Want to know if the big W is tall? Take the height (1.39) and divide it by the breakout price (12.66) to get 1.39/12.66 × 100 or 11.0%. Table 7.5says that a tall pattern needs to have a value above the median 11.9%, so this pattern is short. That suggests underperformance.
The launch price is at H, where the downtrend begins. H could be a post‐breakout target, but as you can see, the stock didn't climb that far.
Volume trends downward (G), so that's good for performance (from Table 7.6). It may be difficult to tell from the chart, but the left bottom has volume of 492 shares and the right bottom has volume of 791. In other words, the right has higher volume and that's good for performance (from Tables 7.10and 7.11).
The pattern is short (bad), volume trends downward (good), and the right bottom has higher volume than the left (good). This seems to suggest a better performing big W. Of the three measures, the height is the most important and it was bad. That's not a good omen.
How did John trade the stock? “I didn't.”
“Why not?”
“I used your simulator to scan charts and didn't like what I saw. I looked for a horizontal move followed by a big W.”
He was referring to my Patternz software (available for free on my website at www.ThePatternSite.com), which has a trading simulator built into it. It will advance to a chart pattern and then play back price at the speed of your choice.
“I saw setup after setup which didn't work so I decided not to trade the stock. Sometimes the best trade you can make is none at all.”
However, another setup is similar to this situation. Imagine the same setup with price forming a top, moving sideways (D), and dropping to a chart pattern (a big W or other type of chart pattern). Price does its thing, and the stock eventually climbs to close above H (the high point in the horizontal D move). That's the time to buy. I describe this setup at http://thepatternsite.com/CPSetup.html( Note: case is important).
In Figure 7.4, price broke out upward from the big W (a close above B) the day before E. That confirmed the big W as a valid chart pattern. Then price stalled as if the bulls were afraid of attacking overhead resistance set up by the sideways move at D.
The stock collapsed, and when price closed below the bottom of the big W, at F, it busted the upward breakout. The stock recovered to poke its head above 13, but moved lower to bottom at 8.11 in December. Had John bought at the breakout price and sold at the ultimate low, he would have lost 36%, not including commissions and fees. He made the right decision to walk away from this trade.
8 Broadening Bottoms
RESULTS SNAPSHOT
Appearance: Price trends downward, leading to the chart pattern. The pattern looks like a megaphone with higher highs and lower lows that widen over time.
Upward Breakouts
| Reversal or continuation | Long‐term bullish reversal |
| Performance rank | 15 out of 39 |
| Breakeven failure rate | 16% |
| Average rise | 45% |
| Volume trend | Upward |
| Throwbacks | 69% |
| Percentage meeting price target | 65% |
| Synonyms | Broadening triangle, five point reversal |
| See also | Broadening tops |
Downward Breakouts
| Reversal or continuation | Short‐term bearish continuation |
| Performance rank | 23 out of 36 |
| Breakeven failure rate | 26% |
| Average drop | 15% |
| Volume trend | Upward |
| Pullbacks | 62% |
| Percentage meeting price target | 41% |
Broadening bottoms are middle‐of‐the‐road performers because the breakeven failure rate and average rise or decline are mediocre. I've traded this pattern only a handful of times over the years but made a profit 75% of the time. Even though performance needs improvement, maybe you can make money trading the pattern. Let's see what broadening bottoms have to offer.
Tour
Figure 8.1shows an example of a broadening bottom. This particular one is called a five‐point reversal because there are five alternating touches, two minor lows (2 and 4) and three minor highs (1, 2, and 3). A five‐point reversal is also rare: In one study, I located only 5 in the 77 broadening bottoms I examined.
Price trends downward in late August and reaches a low 2 days before the chart pattern begins. That brief dip is what I call undershoot, where the stock is so excited as it drops, it dips below the beginning of the chart pattern within 2 weeks of its start. I ignore brief dips and overshoot—a brief rise within 2 weeks of the pattern's start—when determining the trend start (see the Glossary for details) leading to a chart pattern. Price overshooting or undershooting the formation start is common in many chart pattern types.
How does a broadening bottom differ from a broadening top? A broadening bottom has price trending downward into the start of the pattern; a broadening top has price trending up. The difference is arbitrary. I made the distinction thinking that the two might behave differently.
Читать дальшеИнтервал:
Закладка:
Похожие книги на «Encyclopedia of Chart Patterns»
Представляем Вашему вниманию похожие книги на «Encyclopedia of Chart Patterns» списком для выбора. Мы отобрали схожую по названию и смыслу литературу в надежде предоставить читателям больше вариантов отыскать новые, интересные, ещё непрочитанные произведения.


Обсуждение, отзывы о книге «Encyclopedia of Chart Patterns» и просто собственные мнения читателей. Оставьте ваши комментарии, напишите, что Вы думаете о произведении, его смысле или главных героях. Укажите что конкретно понравилось, а что нет, и почему Вы так считаете.