Thomas N. Bulkowski - Encyclopedia of Chart Patterns
Здесь есть возможность читать онлайн «Thomas N. Bulkowski - Encyclopedia of Chart Patterns» — ознакомительный отрывок электронной книги совершенно бесплатно, а после прочтения отрывка купить полную версию. В некоторых случаях можно слушать аудио, скачать через торрент в формате fb2 и присутствует краткое содержание. Жанр: unrecognised, на английском языке. Описание произведения, (предисловие) а так же отзывы посетителей доступны на портале библиотеки ЛибКат.

- Название:Encyclopedia of Chart Patterns
- Автор:
- Жанр:
- Год:неизвестен
- ISBN:нет данных
- Рейтинг книги:3 / 5. Голосов: 1
-
Избранное:Добавить в избранное
- Отзывы:
-
Ваша оценка:
Encyclopedia of Chart Patterns: краткое содержание, описание и аннотация
Предлагаем к чтению аннотацию, описание, краткое содержание или предисловие (зависит от того, что написал сам автор книги «Encyclopedia of Chart Patterns»). Если вы не нашли необходимую информацию о книге — напишите в комментариях, мы постараемся отыскать её.
, Third Edition expands upon Bulkowski's immensely popular Second Edition with fully revised and updated material on chart patterns. Whether you’re new to the stock market or an experienced professional trader, use this book as a reference guide to give you an edge.
Within the pages of this book, you’ll learn how to identify chart patterns, supported by easy-to-understand performance statistics describing how well a pattern works, what the failure rate is, and what special quirks suggest better future performance. You’ll discover how often a stop loss order will trigger at various locations within a chart pattern, how the chart pattern’s performance has evolved over the past three decades, and how to profit from failure by trading busted patterns.
This broadened and revised
offers investors the most comprehensive, up-to-date guide to this popular method of market analysis. Written by a leading expert on chart patterns, Tom Bulkowski, this edition includes revised statistics on 75 chart patterns including 23 new ones, with pictures and performance statistics, packaged within easy-to-read text.
Gain essential knowledge of chart patterns and how they are used to predict price movements in bull and bear markets New tables include how often stops are hit, busted pattern performance, performance over the decades, and special pattern features Joining Tour, Identification Guidelines, Focus on Failures, Statistics, Trading Tactics and Sample Trade is Experience. It puts you in the passenger’s seat so you can share lessons learned from Bulkowski's trades This edition reports on statistics from nearly four times the number of samples used in the Second Edition and ten times the number in the , Third Edition further solidifies the reputation of this book as the leading reference on chart patterns, setting it far above the competition.
Encyclopedia of Chart Patterns — читать онлайн ознакомительный отрывок
Ниже представлен текст книги, разбитый по страницам. Система сохранения места последней прочитанной страницы, позволяет с удобством читать онлайн бесплатно книгу «Encyclopedia of Chart Patterns», без необходимости каждый раз заново искать на чём Вы остановились. Поставьте закладку, и сможете в любой момент перейти на страницу, на которой закончили чтение.
Интервал:
Закладка:

Figure 8.1 A broadening bottom, specifically a five‐point reversal, so‐called because of the five touchpoints: two minor lows (the even numbers) and three minor highs (the odd numbers).
If you ignore undershoot in this case, the broadening bottom appears at the bottom of the downtrend, hence the pattern is a broadening bottom and not a top.
This particular chart pattern shows a partial decline which correctly predicts an upward and immediate breakout. Price moves down from 26 to 24.50, reverses course, and shoots out the top. The stock reached a high of 38.50 just over a year later.
Identification Guidelines
Table 8.1lists identification guidelines for broadening bottoms.
Appearance.The shape of the broadening bottom reminds me of chaos theory where small disturbances oscillate back and forth, then grow unbounded, wreaking havoc.
In the stock market, price begins to bounce between two imaginary barriers that diverge, forming a megaphone shape. When you draw a trendline touching the minor highs along the top and another connecting the minor lows along the bottom, the broadening pattern becomes apparent. Neither the top nor bottom trendlines should be horizontal or near horizontal. Rather, price along the peaks becomes higher and price along the bottoms trends lower. Use the figures in this chapter for guidance.
Table 8.1 Identification Guidelines
| Characteristic | Discussion |
|---|---|
| Appearance | Megaphone shape with higher highs and lower lows. |
| Price trend | The short‐term price trend should be downward, leading to the broadening bottom. Ignore any overshoot or undershoot within 2 weeks of the start of the broadening bottom. |
| Trendlines | Price follows two diverging trendlines: The top one slopes upward and the bottom one slopes downward. |
| Touches | Should have at least five touches: three on one trendline and two on the other, but not necessarily alternating touches. Each touch should be a minor high or a minor low. |
| Whitespace | Price should cross the pattern from top to bottom plenty of times, filling the pattern with price movement, not leaving a large hole of whitespace. |
| Volume | The volume trend from the start to end of the pattern is usually upward. Don't discard a pattern because volume trends downward. |
| Breakout direction | A breakout occurs when price closes above the formation's high (upward breakout) or below the pattern's low (downward breakout). See text for details. The breakout can occur in either direction, and price may move horizontally for months before breaking out. |
Price trend.Price trends downward into the start of a broadening bottom. Even if price rises a week or two before the chart pattern begins (overshoot), ignore it. The pattern is still a bottom. This arbitrary designation makes intuitive sense: A bottom should appear at the end of a downtrend, not when price is climbing to the moon and not if price spiked upward just before the pattern started.
Trendlines.Two trendlines drawn across the minor highs and lows outline the pattern. The top trendline should slope up; the bottom one should slope down. The diverging trendlines distinguish the broadening bottom from other types of chart patterns, such as the right‐angled broadening formation (which has one horizontal trendline) and the broadening wedge (both trendlines slope in the same direction).
Touches.To prevent confusion, I changed the guidelines to require at least five touches, three of one trendline and two of the other. Fewer touches increase the likelihood of misidentification (but it still might be a broadening bottom). Play it safe and look for at least five trendline touches.
Each trendline touch should be at or near a minor high (top trendline) or minor low (bottom trendline). What is a minor high or low? A minor high happens when price trends up, then drops back down, leaving a clearly defined peak. A minor low is just the same except flipped upside down: Price moves lower, and then heads back up, leaving a clearly defined valley.
In Figure 8.1, odd numbers tag the minor highs and the even numbers are the minor lows. Let me stress that the minor highs and lows need not be alternating, as shown in the figure. Just as long as you can count at least five touches, then that's fine. If price cuts through a trendline, then don't count that as a touch.
Notice that at the start of this pattern (on the bottom), price cuts through the lower trendline, but it doesn't count as a touch.
Whitespace. Figure 8.2shows a problem with identification. This is from 3M (MMM) in August 2019. On the left side (“Bad”), the stock appears to make a broadening bottom. It has two touches of the top trendline and three on the bottom, as required. The problem is that white hole in the pattern, which I highlight at A. Price does not cross the pattern enough to fill the space.
Compare the left side with the right side (“Better”). It's the same picture except I show a down‐sloping channel. It's not perfect because of the spike at B, but it'll do. This is a better interpretation of a viable chart pattern compared to the left side. Do not cut off a turn like I've shown on the left side and call it a broadening bottom.
Volume.There is nothing magical or important about volume. I used linear regression from the start of the chart pattern to its end and found that volume trends upward most of the time in this chart pattern.
Breakout direction.The breakout price can be difficult to identify in a broadening chart pattern as the pattern develops. I look for the place where price pierces the up or down trendline or makes an extended move, hugging the trendline.
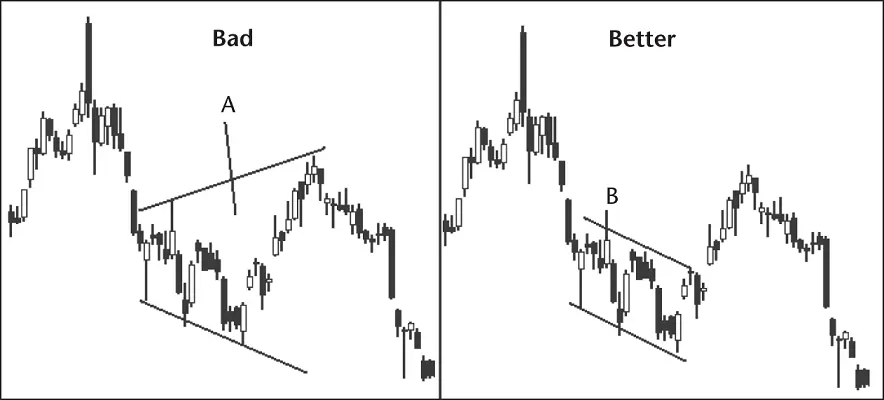
Figure 8.2 Don't accept patterns with too much whitespace. This happens when you cut off a turn and call it a broadening bottom.
If price closes outside a trendline boundary, then the penetration point becomes the breakout price. If price moves up (for example) and follows along the top trendline without piercing it, then I backtrack to the prior minor high and draw a horizontal line forward in time until price closes above the horizontal line. When that happens, that is the breakout point (providing the pattern obeys the other identification guidelines first). Use the same logic for a downward breakout.
Let me give you an example. Consider the broadening bottom shown in Figure 8.3. Where's the breakout from the broadening bottom?
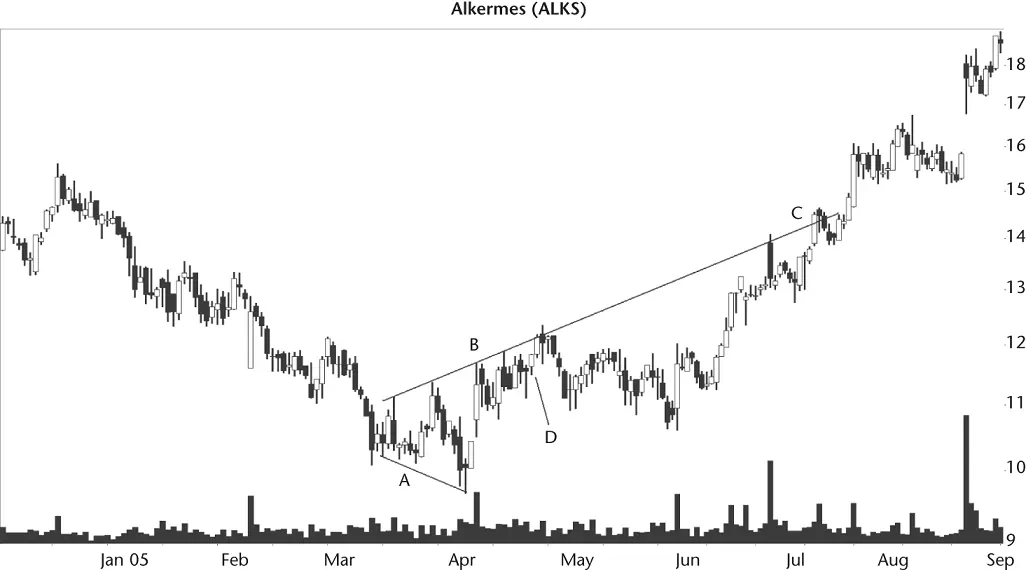
Figure 8.3 Where's the breakout?
If you wait for price to close above the top trendline, then you'd have to wait until C. Imagine if the top trendline were steeper. You might never see a breakout.
If the pattern meets all of the identification guidelines (especially trendline touches) and price begins sliding upward (along the top trendline or downward along the bottom one), like you see from B to D, then go back to the prior minor high (upward breakout) or prior minor low (downward breakout) and use that price as the breakout price. In this case, point B is the prior minor high in the chart pattern and the breakout is point D. If you worry about buying into the broadening bottom too late, then skip the trade. Chart patterns are not like attending a party 15 minutes late. Promptness pays.
Читать дальшеИнтервал:
Закладка:
Похожие книги на «Encyclopedia of Chart Patterns»
Представляем Вашему вниманию похожие книги на «Encyclopedia of Chart Patterns» списком для выбора. Мы отобрали схожую по названию и смыслу литературу в надежде предоставить читателям больше вариантов отыскать новые, интересные, ещё непрочитанные произведения.


Обсуждение, отзывы о книге «Encyclopedia of Chart Patterns» и просто собственные мнения читателей. Оставьте ваши комментарии, напишите, что Вы думаете о произведении, его смысле или главных героях. Укажите что конкретно понравилось, а что нет, и почему Вы так считаете.