Pascal Ribéreau-Gayon - Handbook of Enology, Volume 2
Здесь есть возможность читать онлайн «Pascal Ribéreau-Gayon - Handbook of Enology, Volume 2» — ознакомительный отрывок электронной книги совершенно бесплатно, а после прочтения отрывка купить полную версию. В некоторых случаях можно слушать аудио, скачать через торрент в формате fb2 и присутствует краткое содержание. Жанр: unrecognised, на английском языке. Описание произведения, (предисловие) а так же отзывы посетителей доступны на портале библиотеки ЛибКат.
- Название:Handbook of Enology, Volume 2
- Автор:
- Жанр:
- Год:неизвестен
- ISBN:нет данных
- Рейтинг книги:3 / 5. Голосов: 1
-
Избранное:Добавить в избранное
- Отзывы:
-
Ваша оценка:
Handbook of Enology, Volume 2: краткое содержание, описание и аннотация
Предлагаем к чтению аннотацию, описание, краткое содержание или предисловие (зависит от того, что написал сам автор книги «Handbook of Enology, Volume 2»). Если вы не нашли необходимую информацию о книге — напишите в комментариях, мы постараемся отыскать её.
is thus the same. It aims to provide practitioners, winemakers, technicians and enology students with foundational knowledge and the most recent research results. This knowledge can be used to contribute to a better definition of the quality of grapes and wine, a greater understanding of chemical and microbiological parameters, with the aim of ensuring satisfactory fermentations and predicting the evolution of wines, and better mastery of wine stabilization processes. As a result, the purpose of this publication is to guide readers in their thought processes with a view to preserving and optimizing the identity and taste of wine and its aging potential.
This third English edition of
, is an enhanced translation from the 7th French 2017 edition, and is published as a two-volume set describing aspects of winemaking using a detailed, scientific approach. The authors, who are highly-respected enologists, examine winemaking processes, theorizing what constitutes a perfect technique and the proper combination of components necessary to produce a quality vintage. They also illustrate methodologies of common problems, revealing the mechanism behind the disorder, thus enabling a diagnosis and solution.
Volume 2:
The Chemistry of Wine and Stabilization and Treatments Coverage includes: Wine chemistry; Organic acids; Alcohols and other volatile products; Carbohydrates; Dry extract and mineral matter; Nitrogen substances; Phenolic compounds; The aroma of grape varieties; The chemical nature, origin and consequences of the main organoleptic defects; Stabilization and treatment of wines; The chemical nature, origin and consequences of the main organoleptic defects; The concept of clarity and colloidal phenomena; Clarification and stabilization treatments; Clarification of wines by filtration and centrifugation; The stabilization of wines by physical processes; The aging of wines in vats and in barrels and aging phenomena.
The target audience includes advanced viticulture and enology students, professors and researchers, and practicing grape growers and vintners.
Handbook of Enology, Volume 2 — читать онлайн ознакомительный отрывок
Ниже представлен текст книги, разбитый по страницам. Система сохранения места последней прочитанной страницы, позволяет с удобством читать онлайн бесплатно книгу «Handbook of Enology, Volume 2», без необходимости каждый раз заново искать на чём Вы остановились. Поставьте закладку, и сможете в любой момент перейти на страницу, на которой закончили чтение.
Интервал:
Закладка:
The impact of amino acids with alcohol functions was even more spectacular in dilute alcohol solutions (11% by volume). With only 200 mg/l serine, there was a 1.8 mEq/l increase in buffer capacity compared with only 0.8 mEq/l in water. It was also observed that adding 400 mg/l of each of the five amino acids led to a 10.4 mEq/l (36.8%) increase in the buffer capacity of a dilute alcohol solution containing 40 mM tartaric acid.
It is surprising to note that amino acids have no significant effect on the buffer capacity of a 40 mM malic acid solution ( Figure 1.7).
All these observations highlight the role of the alcohol function, both in the solvent and in the amino acids, in interactions with organic acids, particularly tartaric acid with its two alcohol functions.
The lack of interaction between amino acids and malic acid, both in water and dilute alcohol solution, can be interpreted as being due to the fact that malic acid has one alcohol function as compared with the two alcohol functions of tartaric acid. This factor is important for stabilizing interactions between organic acids and amino acids via hydrogen bonds ( Figure 1.8).
1.4.4 Applying Buffer Capacity to the Acidification and Deacidification of Wine
The addition of tartaric acid is permitted under European Union (EU) legislation, up to a maximum of 1.5 g/l in must and 2.5 g/l in wine. In the United States, acidification is permitted using tartrates combined with gypsum (CaSO 4) (Gomez‐Benitez, 1993). This practice seems justified if the buffer capacity formula ( Equation (1.3)) is considered. The addition of tartaric acid (HA) increases the buffer capacity by increasing the numerator of Equation (1.3)more than the denominator. However, the addition of CaSO 4leads to the precipitation of calcium tartrate, as this salt is relatively insoluble. This reduces the buffer capacity and, as a result, ensures that acidification will be more effective.
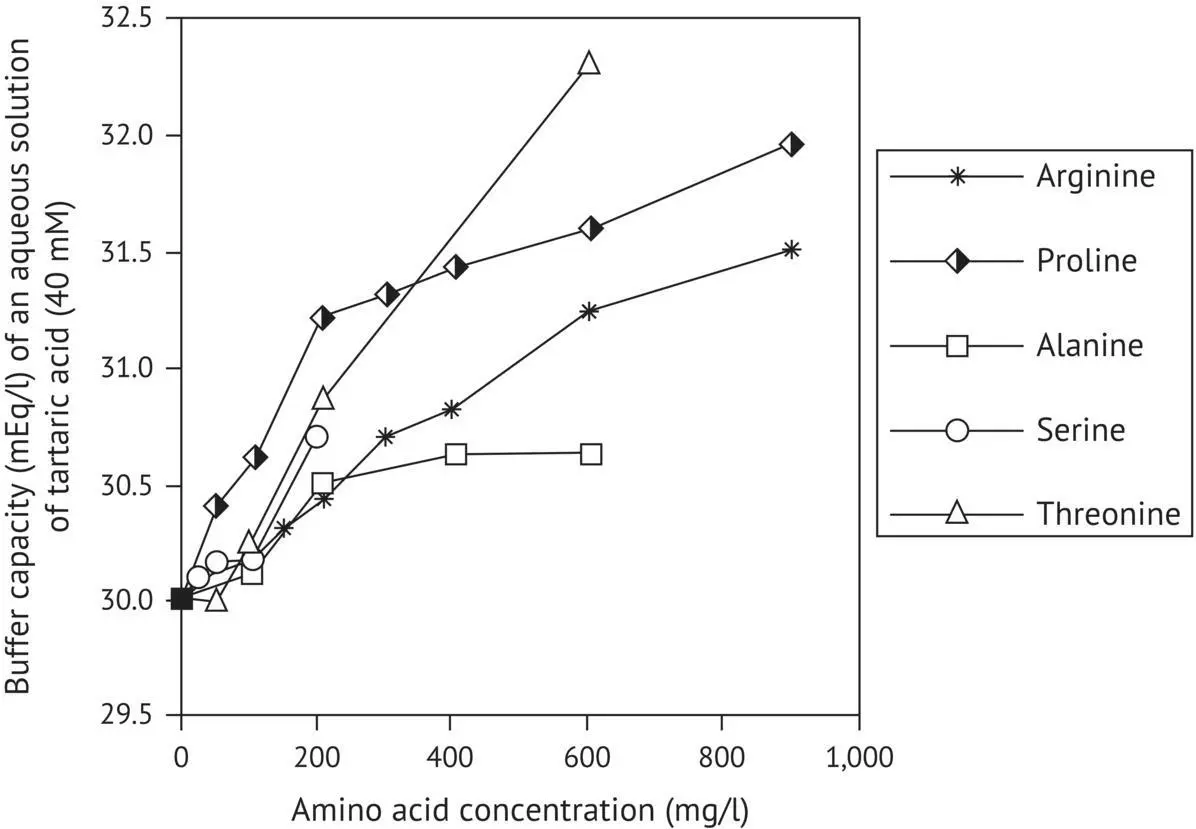
FIGURE 1.6 Variations in the buffer capacity of an aqueous solution of tartaric acid (40 mM) in the presence of several amino acids (Dartiguenave et al ., 2000a).
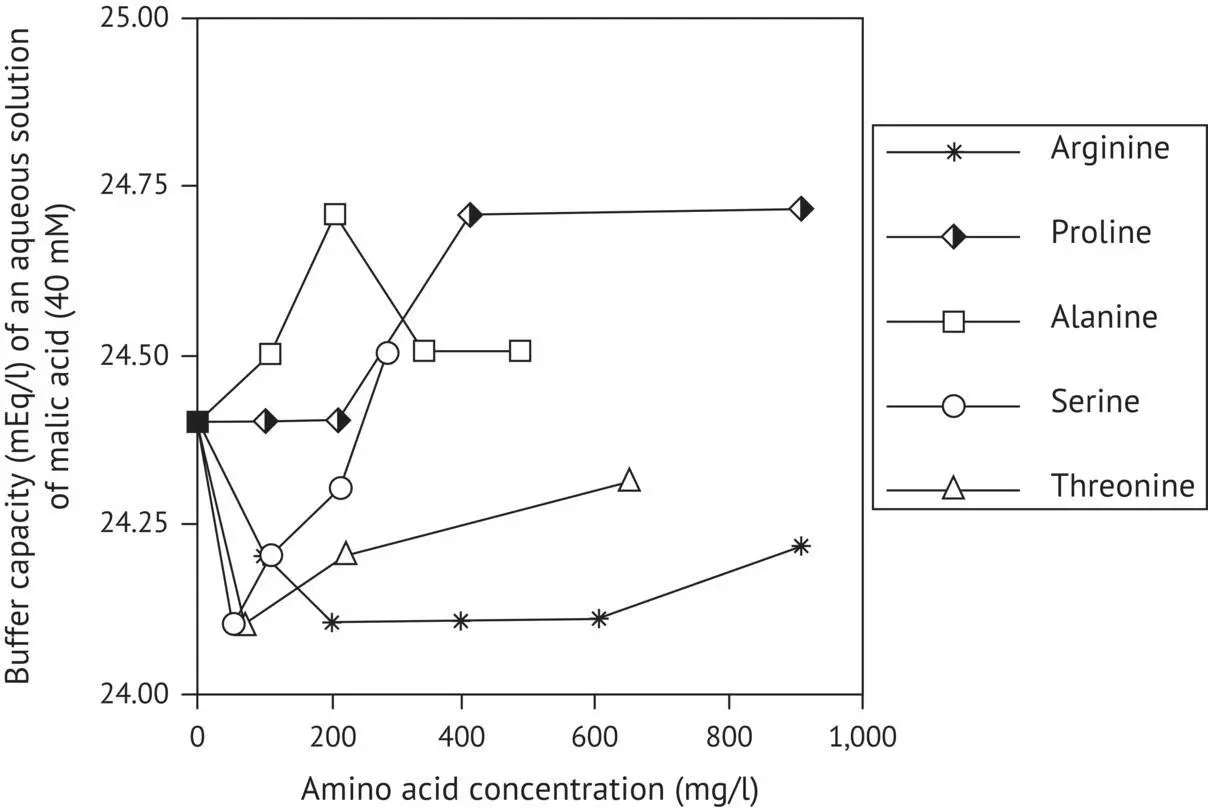
FIGURE 1.7 Variations in the buffer capacity of an aqueous solution of malic acid (40 mM in the presence of several amino acids (Dartiguenave et al ., 2000a)).
Whenever tartrate addition is carried out, the effect on the pH of the medium must also be taken into account in calculating the desired increase in total acidity of the must or wine. Unfortunately, however, there is no simple relationship between total acidity and pH.

FIGURE 1.8 Hypothetical structure of interactions between tartaric acid and amino acids (Dartiguenave et al ., 2000a).
A decrease in pH may occur during bitartrate stabilization, in spite of the decrease in total acidity caused by this process. This may also occur when tartrates are added to must and, in particular, wine, owing to the crystallization of potassium bitartrate, which becomes less soluble in the presence of alcohol.
The major difficulty in tartrate addition is predicting the decrease in pH of the must or wine. Indeed, it is important that this decrease in pH should not be incompatible with the wine's organoleptic qualities, or with a second alcoholic fermentation in the case of sparkling wines. To our knowledge, there is currently no reliable model capable of accurately predicting the drop in pH for a given level of tartrate addition. The problem is not simple, as it depends on a number of parameters. To achieve the required acidification of a wine, it is necessary to know the ratio of the initial concentrations of tartaric acid and potassium, i.e. crystallizable potassium bitartrate.
It is also necessary to know the wine's acid–base buffer capacity. Thus, in the case of wines from cool‐climate regions, initially containing 6 g/l of malic acid and having gone through malolactic fermentation, tartrate addition may be necessary to correct an impression of “flatness” on the palate. Great care must be taken in acidifying this type of wine; otherwise it may have a final pH lower than 2.9, which certainly cures the “flatness” but produces excessive dryness or even greenness. White wines made from red grape varieties may even take on some red color.
Table 1.10shows the values of the physicochemical parameters of acidity in sparkling base wines, made from the cuvée or second pressings of Chardonnay grapes in the 1995 and 1996 vintages. They were acidified with 1 g/l and 1.5 g/l tartaric acid, respectively, after the must had been clarified.
Examination of the results shows that adding 100 g/l to a cuvée must or wine only results in 10–15% acidification, corresponding to an increase in total acidity of approximately 0.5 g/l (H 2SO 4). Evaluating the acidification rate from the buffer capacity gave a similar result. The operation was even less effective when there was a high potassium level, and potassium bitartrate precipitated out when the tartaric acid was added.
Adding the maximum permitted dose of tartaric acid (1.50 g/hl) to second‐pressing must or wine was apparently more effective, as total acidity increased by 35% and pH decreased significantly (−0.14), producing a positive impact on wine stability and flavor. The effect on pH of acidifying wines shows the limitations of adding tartaric acid; there may also be problems with the secondary fermentation in bottle, sometimes resulting in “hard” wines with a metallic mouthfeel.
It would be possible to avoid these negative aspects of acidification by using L(−)lactic acid. This is listed as a food additive (E270) and meets the requirements of both the Food Chemicals Codex and the European Pharmacopoeia . Lactic acid is commonly used in the food and beverage industry, particularly as a substitute for citric acid in carbonated soft drinks and is even added to some South African wines.
Its advantages compared with tartaric acid are a p K aof 3.81 (tartaric acid: 3.01) and the fact that both its potassium and calcium salts are soluble. This enhances the acidification rate while minimizing the decrease in pH. Finally, lactic acid is microbiologically stable, unlike tartaric, malic, and citric acids. Until recently, one disadvantage of industrial lactic acid was a rather unpleasant odor, which justified its prohibition in winemaking. The lactic acid now produced by fermenting sugar industry residues with selected bacteria no longer has this odor.
TABLE 1.10Composition of Chardonnay Wines After Tartrate Stabilization, Depending on the Time of Acidification (Addition to Must or to Wine After Malolactic Fermentation)
| Cuvée | Second pressing | ||||||||
|---|---|---|---|---|---|---|---|---|---|
| 1995 | 1996 | 1996 | |||||||
| Control | Acidified must | Acidified wine | Control | Acidified must | Acidified wine | Control | Acidified must | Acidified wine | |
| pH | 3.06 | 2.97 | 2.97 | 3.06 | 2.99 | 2.97 | 3.18 | 3.04 | 3.00 |
| Total acidity (g/l, H 2SO 4) | 5.2 | 6.0 | 5.6 | 5.4 | 5.9 | 5.8 | 4.1 | 4.9 | 5.0 |
| Tartaric acid (g/l) | 3.6 | 4.0 | 4.3 | 4.4 | 5.2 | 5.0 | 3.4 | 4.6 | 4.8 |
| Malic acid (g/l) | 0.1 | 0.1 | 0.1 | 0.1 | 0.1 | 0.1 | 0.1 | 0.1 | 0.1 |
| Lactic acid (g/l) | 4 | 4.3 | 4.4 | 4.2 | 4.1 | 4.1 | 3 | 3 | 2.7 |
| Total nitrogen (mg/l) | 274.7 | 221.9 | 271 | 251.6 | 280.3 | 289.8 | 245.9 | 250.4 | 254.4 |
| Amino acids (mg/l) | 1,051.4 | 703.7 | 1,322.6 | 1,254.2 | 1,422.7 | 1,471.7 | 1,177.5 | 1,350.4 | 1,145 |
| Potassium (mg/l) | 390 | 345 | 320 | 345 | 290 | 285 | 380 | 305 | 300 |
| Calcium (mg/l) | 71.5 | 90 | 79 | 60 | 64 | 61 | 50 | 55 | 48 |
| Buffer capacity (NaOH, H 2O) | 48.1 | 56.6 | 56.2 | 50.3 | 55.5 | 56.9 | 42.4 | 49.1 | 47.7 |
| Buffer capacity (NaOH, EtOH 11% vol.) | 55.6 | 59.2 | 55.9 | 47.1 | 51.9 | 50.2 | 37.9 | 44.3 | 42 |
Cuvées were acidified with 1 g/l tartaric acid and second pressings with 1.5 g/l (Dartiguenave, 1998).
Читать дальшеИнтервал:
Закладка:
Похожие книги на «Handbook of Enology, Volume 2»
Представляем Вашему вниманию похожие книги на «Handbook of Enology, Volume 2» списком для выбора. Мы отобрали схожую по названию и смыслу литературу в надежде предоставить читателям больше вариантов отыскать новые, интересные, ещё непрочитанные произведения.


Обсуждение, отзывы о книге «Handbook of Enology, Volume 2» и просто собственные мнения читателей. Оставьте ваши комментарии, напишите, что Вы думаете о произведении, его смысле или главных героях. Укажите что конкретно понравилось, а что нет, и почему Вы так считаете.