Pascal Ribéreau-Gayon - Handbook of Enology, Volume 2
Здесь есть возможность читать онлайн «Pascal Ribéreau-Gayon - Handbook of Enology, Volume 2» — ознакомительный отрывок электронной книги совершенно бесплатно, а после прочтения отрывка купить полную версию. В некоторых случаях можно слушать аудио, скачать через торрент в формате fb2 и присутствует краткое содержание. Жанр: unrecognised, на английском языке. Описание произведения, (предисловие) а так же отзывы посетителей доступны на портале библиотеки ЛибКат.
- Название:Handbook of Enology, Volume 2
- Автор:
- Жанр:
- Год:неизвестен
- ISBN:нет данных
- Рейтинг книги:3 / 5. Голосов: 1
-
Избранное:Добавить в избранное
- Отзывы:
-
Ваша оценка:
Handbook of Enology, Volume 2: краткое содержание, описание и аннотация
Предлагаем к чтению аннотацию, описание, краткое содержание или предисловие (зависит от того, что написал сам автор книги «Handbook of Enology, Volume 2»). Если вы не нашли необходимую информацию о книге — напишите в комментариях, мы постараемся отыскать её.
is thus the same. It aims to provide practitioners, winemakers, technicians and enology students with foundational knowledge and the most recent research results. This knowledge can be used to contribute to a better definition of the quality of grapes and wine, a greater understanding of chemical and microbiological parameters, with the aim of ensuring satisfactory fermentations and predicting the evolution of wines, and better mastery of wine stabilization processes. As a result, the purpose of this publication is to guide readers in their thought processes with a view to preserving and optimizing the identity and taste of wine and its aging potential.
This third English edition of
, is an enhanced translation from the 7th French 2017 edition, and is published as a two-volume set describing aspects of winemaking using a detailed, scientific approach. The authors, who are highly-respected enologists, examine winemaking processes, theorizing what constitutes a perfect technique and the proper combination of components necessary to produce a quality vintage. They also illustrate methodologies of common problems, revealing the mechanism behind the disorder, thus enabling a diagnosis and solution.
Volume 2:
The Chemistry of Wine and Stabilization and Treatments Coverage includes: Wine chemistry; Organic acids; Alcohols and other volatile products; Carbohydrates; Dry extract and mineral matter; Nitrogen substances; Phenolic compounds; The aroma of grape varieties; The chemical nature, origin and consequences of the main organoleptic defects; Stabilization and treatment of wines; The chemical nature, origin and consequences of the main organoleptic defects; The concept of clarity and colloidal phenomena; Clarification and stabilization treatments; Clarification of wines by filtration and centrifugation; The stabilization of wines by physical processes; The aging of wines in vats and in barrels and aging phenomena.
The target audience includes advanced viticulture and enology students, professors and researchers, and practicing grape growers and vintners.
Handbook of Enology, Volume 2 — читать онлайн ознакомительный отрывок
Ниже представлен текст книги, разбитый по страницам. Система сохранения места последней прочитанной страницы, позволяет с удобством читать онлайн бесплатно книгу «Handbook of Enology, Volume 2», без необходимости каждый раз заново искать на чём Вы остановились. Поставьте закладку, и сможете в любой момент перейти на страницу, на которой закончили чтение.
Интервал:
Закладка:
Another advantage of partial elimination of malic acid over malolactic fermentation, followed by the addition of tartrate, is that, due to the low acidification rate, it does not produce wines with too low a pH. Low pH can be responsible for difficult or stuck secondary fermentation in the bottle during sparkling winemaking via the traditional method ( méthode champenoise ), leaving residual sugar in the wine.
Traditional acidification and deacidification methods are aimed solely at changing total acidity levels, with no concern for the impact on pH and even less for the buffer capacity of the wine and with all the unfortunate consequences this may have on flavor and aging potential.
This is certainly due to the lack of awareness of the importance of the acid–base buffer capacity in winemaking. Changes in the acid–base characteristics of a wine require knowledge of not only its total acidity and pH but also of its buffer capacity. These three parameters may be measured using a pH meter. Few articles in the literature deal with the buffer capacity of wine (Genevois and Ribéreau‐Gayon, 1935; Vergnes, 1940; Hochli, 1997; Dartiguenave et al ., 2000a). This lack of knowledge is probably related to the fact that buffer capacity cannot be measured directly but rather requires readings of four or five points on a neutralization curve ( Figure 1.3), and this is not one of the regular analyses carried out by winemakers.
It is now possible to automate the plotting of a neutralization curve, based on the wine's initial pH and total acidity, and thus measuring buffer capacity at the main stages in winemaking should become a routine.
Mathematically and geometrically, buffer capacity, β , and buffer range are deduced from the Henderson–Hasselbalch equation ( Section 1.4.2, Equation (1.2)). Buffer capacity is defined by Equation (1.3):
(1.3) 
where ΔB is the number of strong base equivalents that cause an increase in pH equal to ΔpH. Buffer range is a way of assessing buffer capacity. For an organic acid alone, with its salt in solution, it may be defined as the pH interval in which the buffer effect is optimum ( Equation (1.4)):
(1.4) 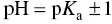
Buffer capacity is normally defined in relation to a strong base, but it could clearly be defined in the same way in relation to a strong acid. In this case, the pH = f (strong acid) function decreases, and its β differential is negative, i.e.:
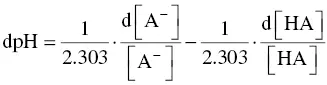
Strictly speaking, buffer capacity is obtained from the differential of the Henderson–Hasselbalch expression, i.e. from the following derived formula:
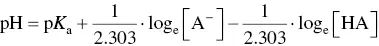
as only the Napierian logarithm is geometrically significant and provides access to the slope of the titration curve around its p K a( Figure 1.4).
The differential of the equation is as follows:
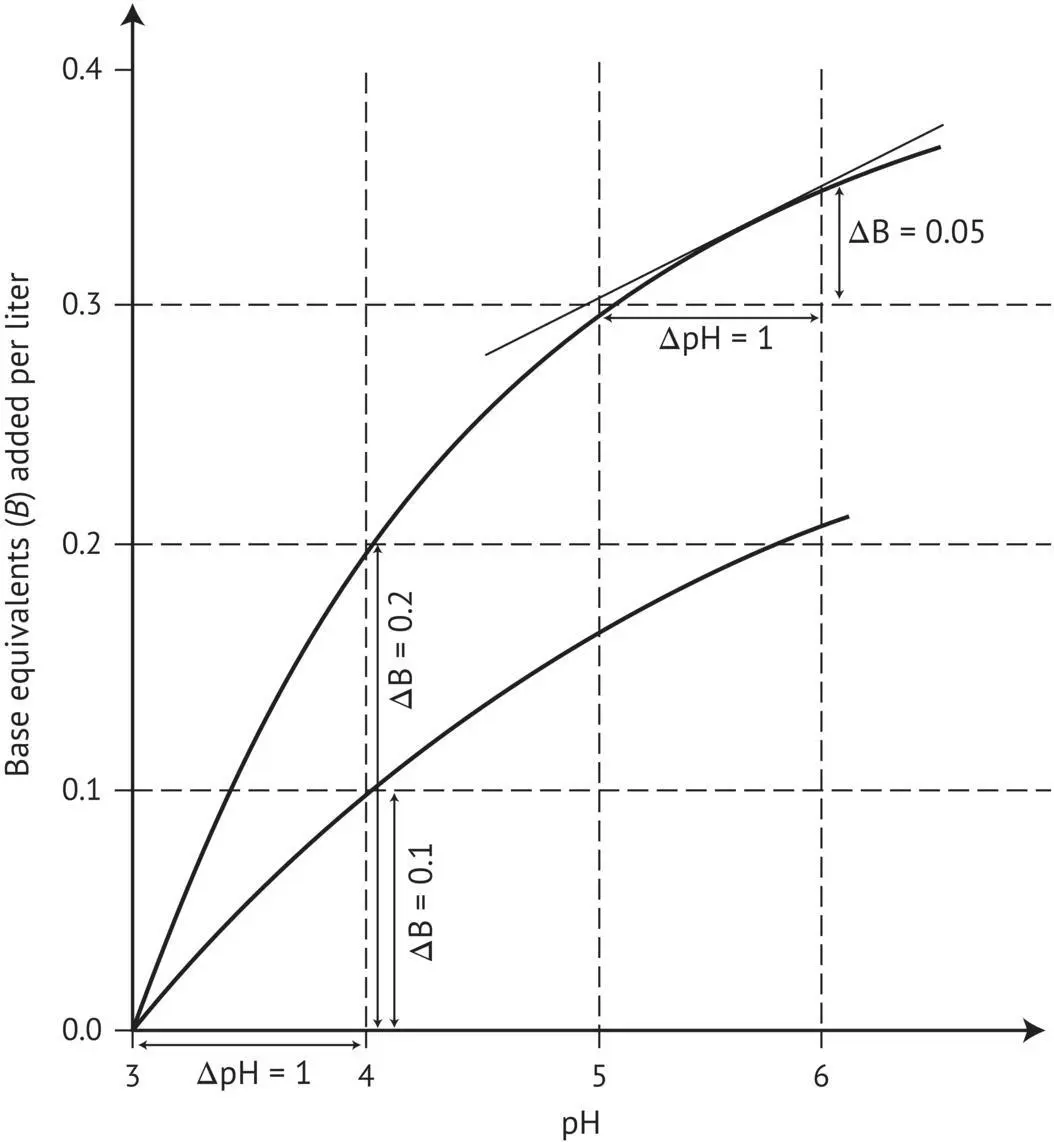
FIGURE 1.4 Determining the buffer capacity β from the titration curves of two model buffer solutions.
Making the assumption that the quantity of strong base added, d[B], generates the same variation in acidity in salt form, d[A −], and leads to an equal decrease in free acidity d[HA], per unit, i.e.:
the differential equation for pH is then
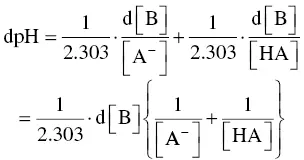
or,
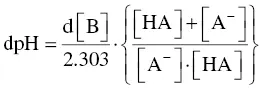
Dividing both sides of the equation by d[B] gives the inverse of Equation (1.3), defining the buffer capacity. Theoretically, variations ΔB and ΔpH must be infinitely small, as the value of the ΔB/ΔpH ratio at a fixed pH corresponds geometrically to the tangent on each point on the titration curve ( Figure 1.4). More practically, buffer capacity can be defined as the number of strong base equivalents required to cause an increase in pH of 1 unit per liter of must or wine. It is even more practical to calculate smaller pH variations in much smaller samples (e.g. 30 ml). Figure 1.4clearly shows the difference in buffer capacity of a model solution between pH 3 and 4, as well as between pH 4 and 5.
This raises the issue of the pH and p K aat which buffer range should be assessed. Champagnol (1986) suggested that pH should be taken as the mean of the p K aof the organic acids in the must or wine, i.e. the mean p K aof tartaric and malic acids in must and tartaric and lactic acids in wine that has completed malolactic fermentation.
This convention is justified by its convenience, provided that ( Section 1.4.2) the neutralization curves of the must or wine have no inflection points representative of the p K aof the organic acids present, since their buffer ranges overlap, at least partially. In addition to these somewhat theoretical considerations, there are also some more practical issues. An aqueous solution of sodium hydroxide is used to determine the titration curve of a must or wine in order to measure total acidity and buffer capacity. Sodium, rather than potassium, hydroxide used as the sodium salt of tartaric acid is soluble, while potassium bitartrate would be likely to precipitate out during titration. It is, however, questionable to use the same aqueous sodium hydroxide solution for both must and for a dilute alcohol solution like wine.
Strictly speaking, a sodium hydroxide solution in dilute alcohol should be used for wine to avoid modifying the alcohol content and, consequently, the dielectric constant and, thus, the dissociation of the acids in the solution during the assay. It has been demonstrated (Dartiguenave et al ., 2000b) that the buffer capacities of organic acids, singly ( Tables 1.4and 1.5) or in binary ( Table 1.6) and tertiary ( Table 1.7) combinations, are different in water and in 11% dilute alcohol solution. However, if the solvent containing the organic acids and the sodium hydroxide is the same, there is a close linear correlation between the buffer capacity and the acid concentrations ( Table 1.4).
TABLE 1.4Equations for Calculating Buffer Capacity (mEq/l) Depending on the Concentration (mM) of the Organic Acid in Water or Dilute Alcohol Solution (11% vol.) Between 0 and 40 mM (Dartiguenave et al., 2000b)
| Solvent | Water | Dilute alcohol solution |
|---|---|---|
| Tartaric acid | Y = 0.71 x + 0.29; R 2= 1 | Y = 0.60 x + 1.33; R 2= 1 |
| Malic acid | Y = 0.56 x + 0.43; R = 0.998 | Y = 0.47 x + 0.33; R 2= 0.987 |
| Succinic acid | Y = 0.56 x − 1.38 × 10 −2; R 2= 0.993 | Y = 0.53 x + 0.52; R 2= 0.995 |
| Citric acid | Y = 0.57 x + 0.73; R 2= 1 | Y = 0.51 x + 0.62; R 2= 1 |
Table 1.5shows the values (mEq/l) calculated from the regression lines of the buffer capacities for acid concentrations varying from 1 to 6 g/l in water and in 11% dilute alcohol solution. The buffer capacity of each acid alone in dilute alcohol solution is lower than in water. Furthermore, the buffer capacity of a four‐carbon organic acid varies more as the number of alcohol functions increases ( Table 1.8). Thus, the variation in buffer capacity of malic acid, a diacid with one alcohol function, in a dilute alcohol medium, is 1.4 mEq/l higher than that of succinic acid. When the hydroxy acid has two alcohol functions, the increase is as high as 5.3 mEq/l (17.7%) between tartaric and malic acids, even if the buffer capacities of the three acids are lower than in water.
Читать дальшеИнтервал:
Закладка:
Похожие книги на «Handbook of Enology, Volume 2»
Представляем Вашему вниманию похожие книги на «Handbook of Enology, Volume 2» списком для выбора. Мы отобрали схожую по названию и смыслу литературу в надежде предоставить читателям больше вариантов отыскать новые, интересные, ещё непрочитанные произведения.


Обсуждение, отзывы о книге «Handbook of Enology, Volume 2» и просто собственные мнения читателей. Оставьте ваши комментарии, напишите, что Вы думаете о произведении, его смысле или главных героях. Укажите что конкретно понравилось, а что нет, и почему Вы так считаете.