Rudy Bilous - Handbook of Diabetes
Здесь есть возможность читать онлайн «Rudy Bilous - Handbook of Diabetes» — ознакомительный отрывок электронной книги совершенно бесплатно, а после прочтения отрывка купить полную версию. В некоторых случаях можно слушать аудио, скачать через торрент в формате fb2 и присутствует краткое содержание. Жанр: unrecognised, на английском языке. Описание произведения, (предисловие) а так же отзывы посетителей доступны на портале библиотеки ЛибКат.
- Название:Handbook of Diabetes
- Автор:
- Жанр:
- Год:неизвестен
- ISBN:нет данных
- Рейтинг книги:3 / 5. Голосов: 1
-
Избранное:Добавить в избранное
- Отзывы:
-
Ваша оценка:
Handbook of Diabetes: краткое содержание, описание и аннотация
Предлагаем к чтению аннотацию, описание, краткое содержание или предисловие (зависит от того, что написал сам автор книги «Handbook of Diabetes»). Если вы не нашли необходимую информацию о книге — напишите в комментариях, мы постараемся отыскать её.
Now in its fifth edition, this market-leading book aligns with the most recent guidelines from the American Diabetes Association (ADA), the European Association for the Study of Diabetes (EASD), Diabetes UK, and the National Institute for Health and Care Excellence (NICE), presenting authoritative clinical coverage of diabetes in an accessible format with rich pedagogical features.
Five new chapters provide detailed coverage of liver disease, diabetes education, bariatric surgery, diabetes and cancer, and the use of incretin-based therapies and SGLT2 Inhibitors in the management of Type II diabetes Updated and expanded topics include the relation between hypoglycaemia and dementia, anxiety and depression, the NICE Quality and Outcomes Framework (QOF), and the impacts of diabetes to self-care, mental health, and decision-making Provides a wealth of pedagogical features such as vignettes and case histories, important learning points, summaries of key clinical trials, and links to further readings
remains the essential practical companion for all health professionals involved in managing patients with diabetes, and an up-to-date reference for diabetes and endocrinology researchers, scientists, and academics.
Handbook of Diabetes — читать онлайн ознакомительный отрывок
Ниже представлен текст книги, разбитый по страницам. Система сохранения места последней прочитанной страницы, позволяет с удобством читать онлайн бесплатно книгу «Handbook of Diabetes», без необходимости каждый раз заново искать на чём Вы остановились. Поставьте закладку, и сможете в любой момент перейти на страницу, на которой закончили чтение.
Интервал:
Закладка:
FPG, 2‐h PG after 75‐g OGTT, and A1C are equally appropriate for diagnostic testing. It should be noted that the tests do not necessarily detect diabetes in the same individuals. The concordance between the FPG and 2‐h PG tests is imperfect. The overlap depends on the ethnic and geographical population, and on other characteristics such as age and body mass index. Some individuals have asymptomatic, isolated post‐challenge hyperglycaemia, while others have fasting hyperglycaemia but normal post‐load glycaemic responses. The fasting criteria for diabetes tend to pick out younger and more obese subjects.
Table 3.2Use of HbA1c >6.5% (48 mmol/mol) as a cut‐off for making the diagnosis of diabetes offers some advantages but there are several disadvantages.
| Advantages | Disadvantages |
|---|---|
| Avoids the need for a fasting blood sample, and the pre‐analytical instability of glucose measurements.HbA1c reflects glycaemia over several weeks.Lower biological variability of HbA1c compared with FPG or 2 h glucose.Virtual absence of significant retinopathy among people with HbA1c < 6.5%. | HbA1c measurements can give spurious results in:anaemia (Fe‐deficiency)haemoglobinopathiesrenal failuredifferent ethnic groups.Diagnosis by HbA1c will identify a different population to that diagnosed by FPG.Distribution of HbA1c values varies in different ethnic groups.HbA1c increases with ageSome patients and ethnic groups may be diagnosed with diabetes by some criteria but not others. |
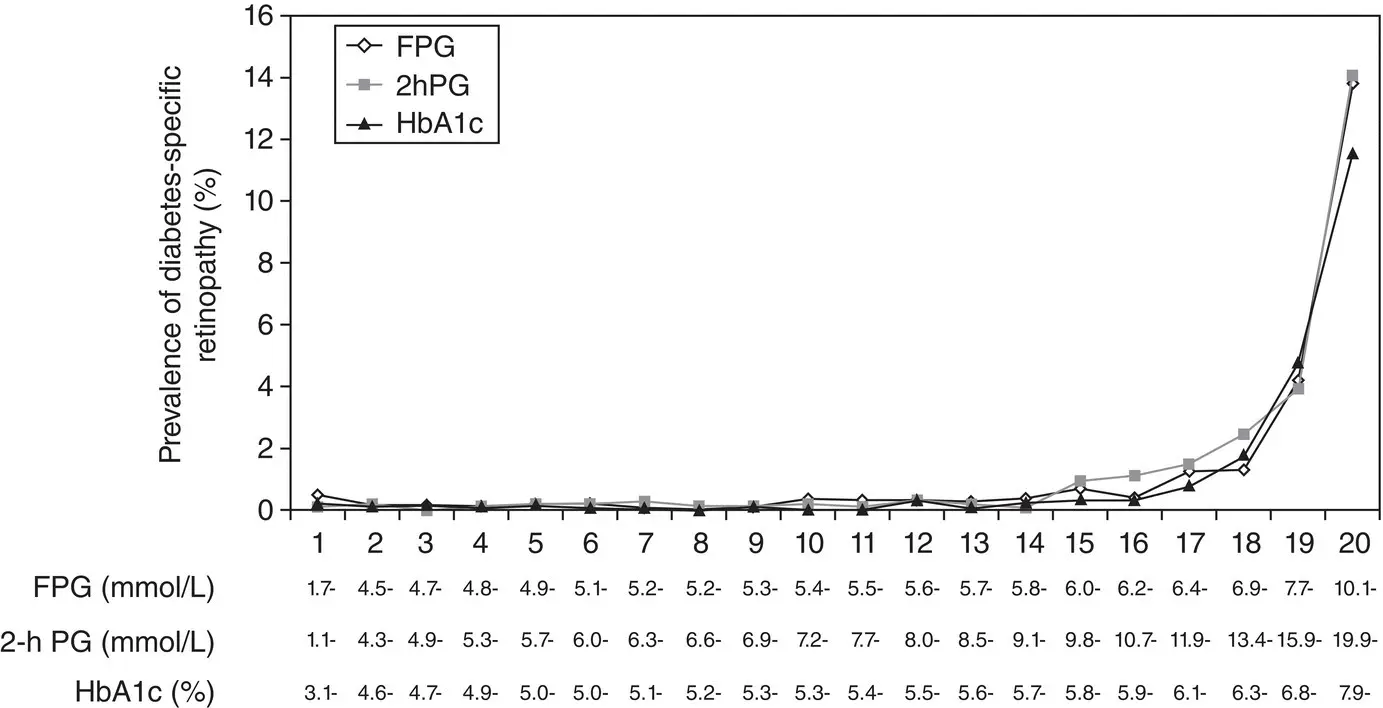
Figure 3.1 Prevalence of diabetes‐specific retinopathy (moderate or more severe retinopathy) by vigintiles of the distribution of FPG, 2‐h PG, and A1C.
Adapted from Colaguiri et al. Diabetes Care 2011; 34: 145‐150.
Numerous studies have confirmed that, compared with FPG and A1C cut points, the 2‐h PG value diagnoses more people with diabetes. When using A1C to diagnose diabetes, it is important to recognize that A1C is an indirect measure of average blood glucose levels and to take other factors into consideration that may impact haemoglobin glycation independently of glycaemia including age, race/ethnicity, and anaemia/haemoglobinopathies.
Intermediate categories of hyperglycaemia: Pre‐diabetes
During the natural history of all forms of diabetes, the disease passes through a stage of impaired glucose tolerance (IGT), defined as a plasma glucose of 7.8–11.0 mmol/L (140–200 mg/dL) 2 hours after an OGTT ( Figure 3.2). Impaired fasting glucose (IFG) is an analogous category based on fasting glucose levels, and is defined as a FPG of 6.1–6.9 mmol/L (110–126 mg/dL).
IGT and IFG are intermediate metabolic stages between normal glucose homeostasis and diabetes. They are both risk factors for future diabetes and cardiovascular disease, but the 2‐hour plasma glucose concentration is a particularly strong predictor of cardiovascular risk and mortality.
As with the glucose measures, several prospective studies that used A1C to predict the progression to diabetes as defined by A1C criteria demonstrated a strong, continuous association between A1C and subsequent diabetes. Based on numerous studies and meta‐analysis, it is now considered that A1C range of 5.7–6.4% (39–47 mmol/mol) as identifying individuals with prediabetes or with impaired glucose regulation IGR).
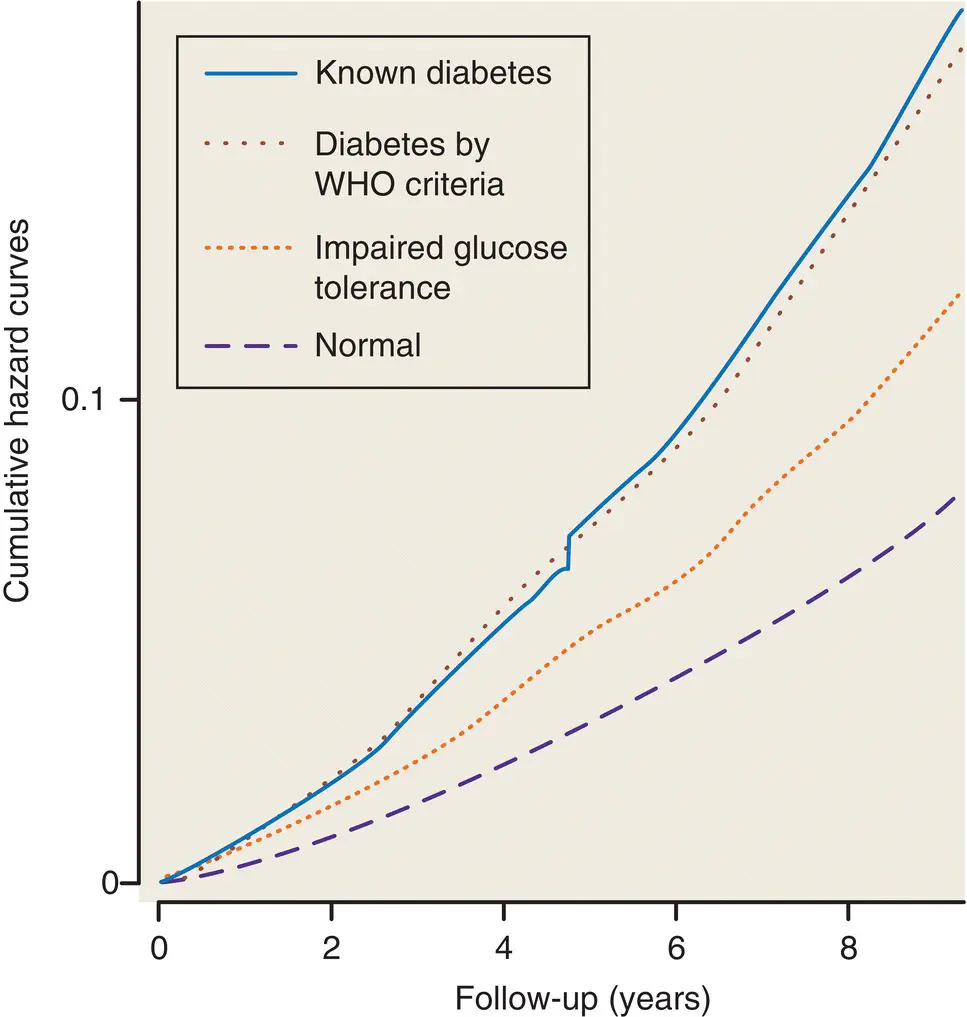
Figure 3.2 The relationship between 2‐hour plasma glucose and survival in patients with normal glucose tolerance, patients with IGT, those with newly‐diagnosed diabetes by OGTT, and those with known diabetes, as shown by the DECODE study (combining data from 13 European cohort studies). From Glucose tolerance and mortality: comparison of WHO and American Diabetic Association diagnostic criteria. The Lancet 354(9179), 617–621.
A proportion of patients with IFG, IGT and/or IGR (5‐10% per annum) will deteriorate metabolically into overt diabetes. Lifestyle modification (diet, exercise and weight loss) is the best approach to diabetes prevention for these patients.
For an OGTT, the subject is tested in the morning after an overnight fast, in the seated position. After taking a fasting blood sample, 75 g of glucose is given by mouth, often in the form of a glucose drink such as Lucozade (843 mL based on the new formulation of 8.9g/100ml of glucose). For children, the glucose dose is calculated as 1.75 g/kg. A further blood sample is taken at 2 hours, and the fasting and 2 hour glucose values are interpreted as in Figure 3.3.
Glycosuria (the presence of glucose in the urine) is responsible for the classic diabetic symptoms and was previously regarded as a diagnostic hallmark of the disease. Nowadays, it indicates the need to test blood glucose, but cannot be used to diagnose diabetes because of the poor relationship between blood and urine glucose ( Figure 3.6). This is for several reasons: the renal threshold for glucose reabsorption varies considerably within and between individuals, the urine glucose concentration is affected by the subject’s state of hydration and the result reflects the average blood glucose during the period that urine has accumulated in the bladder. The average renal threshold is 10 mmol/L (i.e. blood glucose concentration above this level will ‘spill over’ into the urine), but a negative urine test can be associated with marked hyperglycaemia.
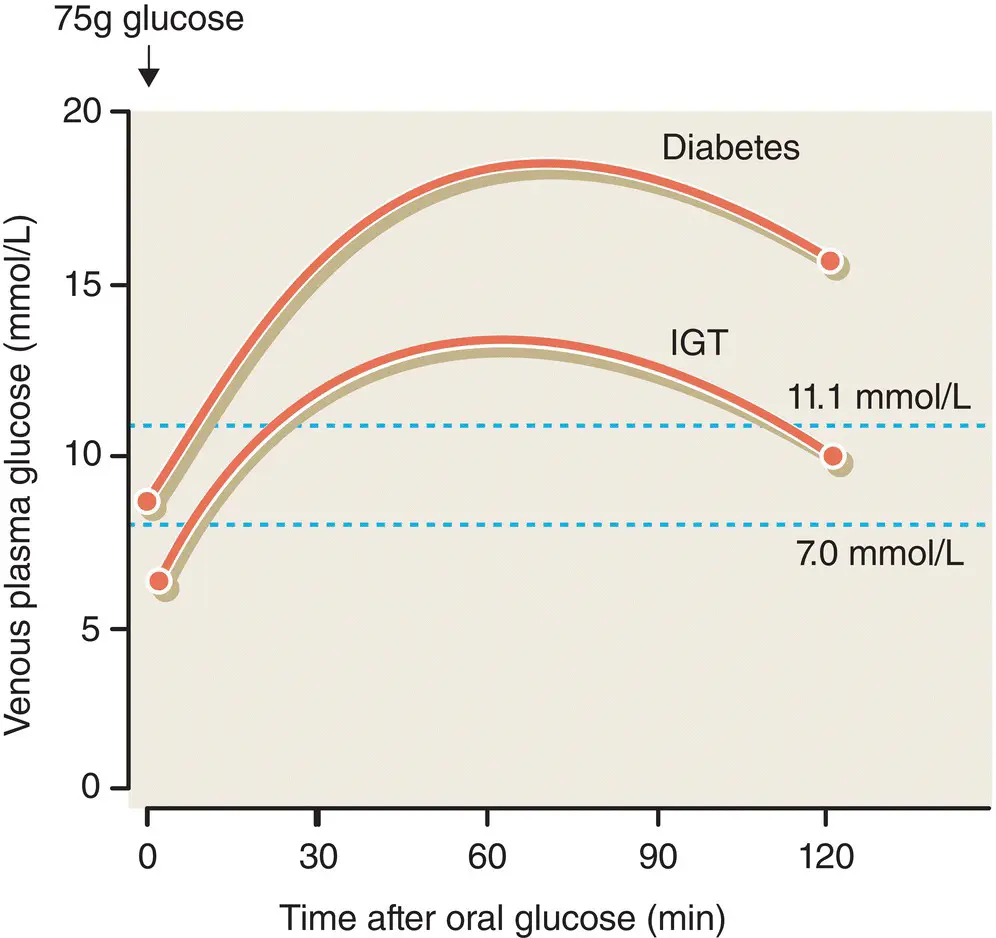
Figure 3.3 Diagnosis of diabetes and IGT by the oral glucose tolerance test .
Longer term indices of hyperglycaemia include the HbA1c, a measure of integrated blood glucose control over the preceding few weeks. HbA1c is used primarily to assess glycaemic control among people with diabetes on treatment. HbA1c analyses are now being calibrated to the IFCC assay. Thus the units of HbA1c in many countries have changed from percent to mmol/mol ( Table 3.3).
Table 3.3 Historically, HbA1c has been reported in percentage values describing the proportion of haemoglobin that is glycated. The assay was aligned to that used in the Diabetes Control and Complications (DCCT) trial. The International Federation of Clinical Chemistry (IFCC) has now established a new reference system, and values will be reported in mmol HbA1c per mol haemoglobin without glucose attached. Conversion for HbA1c is shown below.
| DCCT (%) | IFCC (mmol/mol) | DCCT (%) | IFCC (mmol/mol) |
|---|---|---|---|
| 6.0 | 42 | 9.0 | 75 |
| 6.2 | 44 | 9.2 | 77 |
| 6.4 | 46 | 9.4 | 79 |
| 6.5 | 48 | 9.5 | 80 |
| 6.6 | 49 | 9.6 | 81 |
| 6.8 | 51 | 9.8 | 84 |
| 7.0 | 53 | 10.0 | 86 |
| 7.2 | 55 | 10.2 | 88 |
| 7.4 | 57 | 10.4 | 90 |
| 7.5 | 58 | 10.5 | 91 |
| 7.6 | 60 | 10.6 | 92 |
| 7.8 | 62 | 10.8 | 95 |
| 8.0 | 64 | 11.0 | 97 |
| 8.2 | 66 | 11.2 | 99 |
| 8.4 | 68 | 11.4 | 101 |
| 8.5 | 69 | 11.5 | 102 |
| 8.6 | 70 | 11.6 | 103 |
| 8.8 | 73 | 11.8 | 105 |
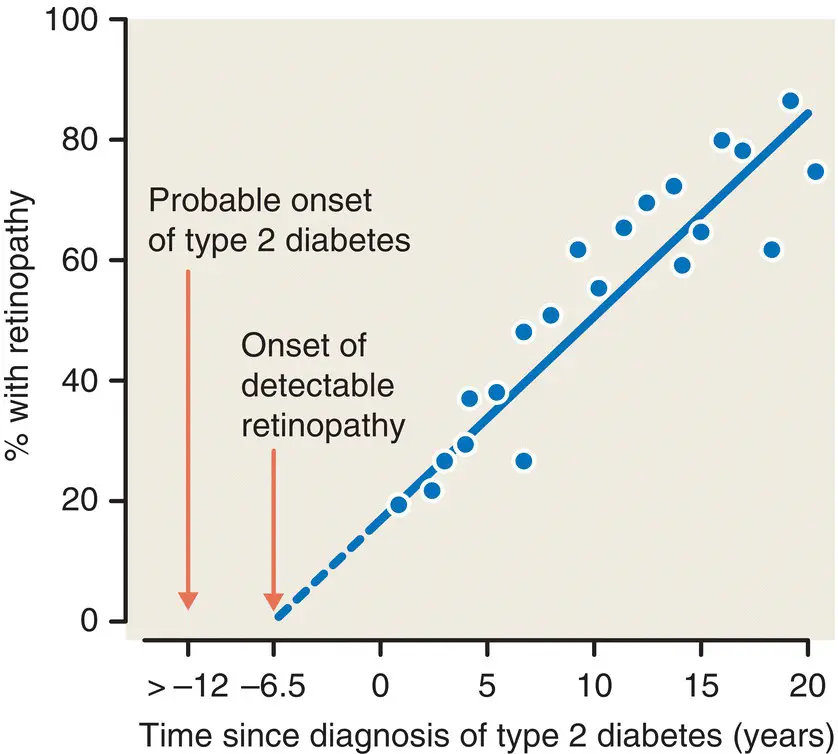
Figure 3.4 The prevalence of retinopathy in type 2 diabetes relative to the time of clinical diagnosis. Note the presence of retinopathy at diagnosis and the likely onset of retinopathy and diabetes some years before diagnosis . From Paisey. Diabetologia 1980; 19: 31 – 34.
Читать дальшеИнтервал:
Закладка:
Похожие книги на «Handbook of Diabetes»
Представляем Вашему вниманию похожие книги на «Handbook of Diabetes» списком для выбора. Мы отобрали схожую по названию и смыслу литературу в надежде предоставить читателям больше вариантов отыскать новые, интересные, ещё непрочитанные произведения.


Обсуждение, отзывы о книге «Handbook of Diabetes» и просто собственные мнения читателей. Оставьте ваши комментарии, напишите, что Вы думаете о произведении, его смысле или главных героях. Укажите что конкретно понравилось, а что нет, и почему Вы так считаете.