Rudy Bilous - Handbook of Diabetes
Здесь есть возможность читать онлайн «Rudy Bilous - Handbook of Diabetes» — ознакомительный отрывок электронной книги совершенно бесплатно, а после прочтения отрывка купить полную версию. В некоторых случаях можно слушать аудио, скачать через торрент в формате fb2 и присутствует краткое содержание. Жанр: unrecognised, на английском языке. Описание произведения, (предисловие) а так же отзывы посетителей доступны на портале библиотеки ЛибКат.
- Название:Handbook of Diabetes
- Автор:
- Жанр:
- Год:неизвестен
- ISBN:нет данных
- Рейтинг книги:3 / 5. Голосов: 1
-
Избранное:Добавить в избранное
- Отзывы:
-
Ваша оценка:
Handbook of Diabetes: краткое содержание, описание и аннотация
Предлагаем к чтению аннотацию, описание, краткое содержание или предисловие (зависит от того, что написал сам автор книги «Handbook of Diabetes»). Если вы не нашли необходимую информацию о книге — напишите в комментариях, мы постараемся отыскать её.
Now in its fifth edition, this market-leading book aligns with the most recent guidelines from the American Diabetes Association (ADA), the European Association for the Study of Diabetes (EASD), Diabetes UK, and the National Institute for Health and Care Excellence (NICE), presenting authoritative clinical coverage of diabetes in an accessible format with rich pedagogical features.
Five new chapters provide detailed coverage of liver disease, diabetes education, bariatric surgery, diabetes and cancer, and the use of incretin-based therapies and SGLT2 Inhibitors in the management of Type II diabetes Updated and expanded topics include the relation between hypoglycaemia and dementia, anxiety and depression, the NICE Quality and Outcomes Framework (QOF), and the impacts of diabetes to self-care, mental health, and decision-making Provides a wealth of pedagogical features such as vignettes and case histories, important learning points, summaries of key clinical trials, and links to further readings
remains the essential practical companion for all health professionals involved in managing patients with diabetes, and an up-to-date reference for diabetes and endocrinology researchers, scientists, and academics.
Handbook of Diabetes — читать онлайн ознакомительный отрывок
Ниже представлен текст книги, разбитый по страницам. Система сохранения места последней прочитанной страницы, позволяет с удобством читать онлайн бесплатно книгу «Handbook of Diabetes», без необходимости каждый раз заново искать на чём Вы остановились. Поставьте закладку, и сможете в любой момент перейти на страницу, на которой закончили чтение.
Интервал:
Закладка:
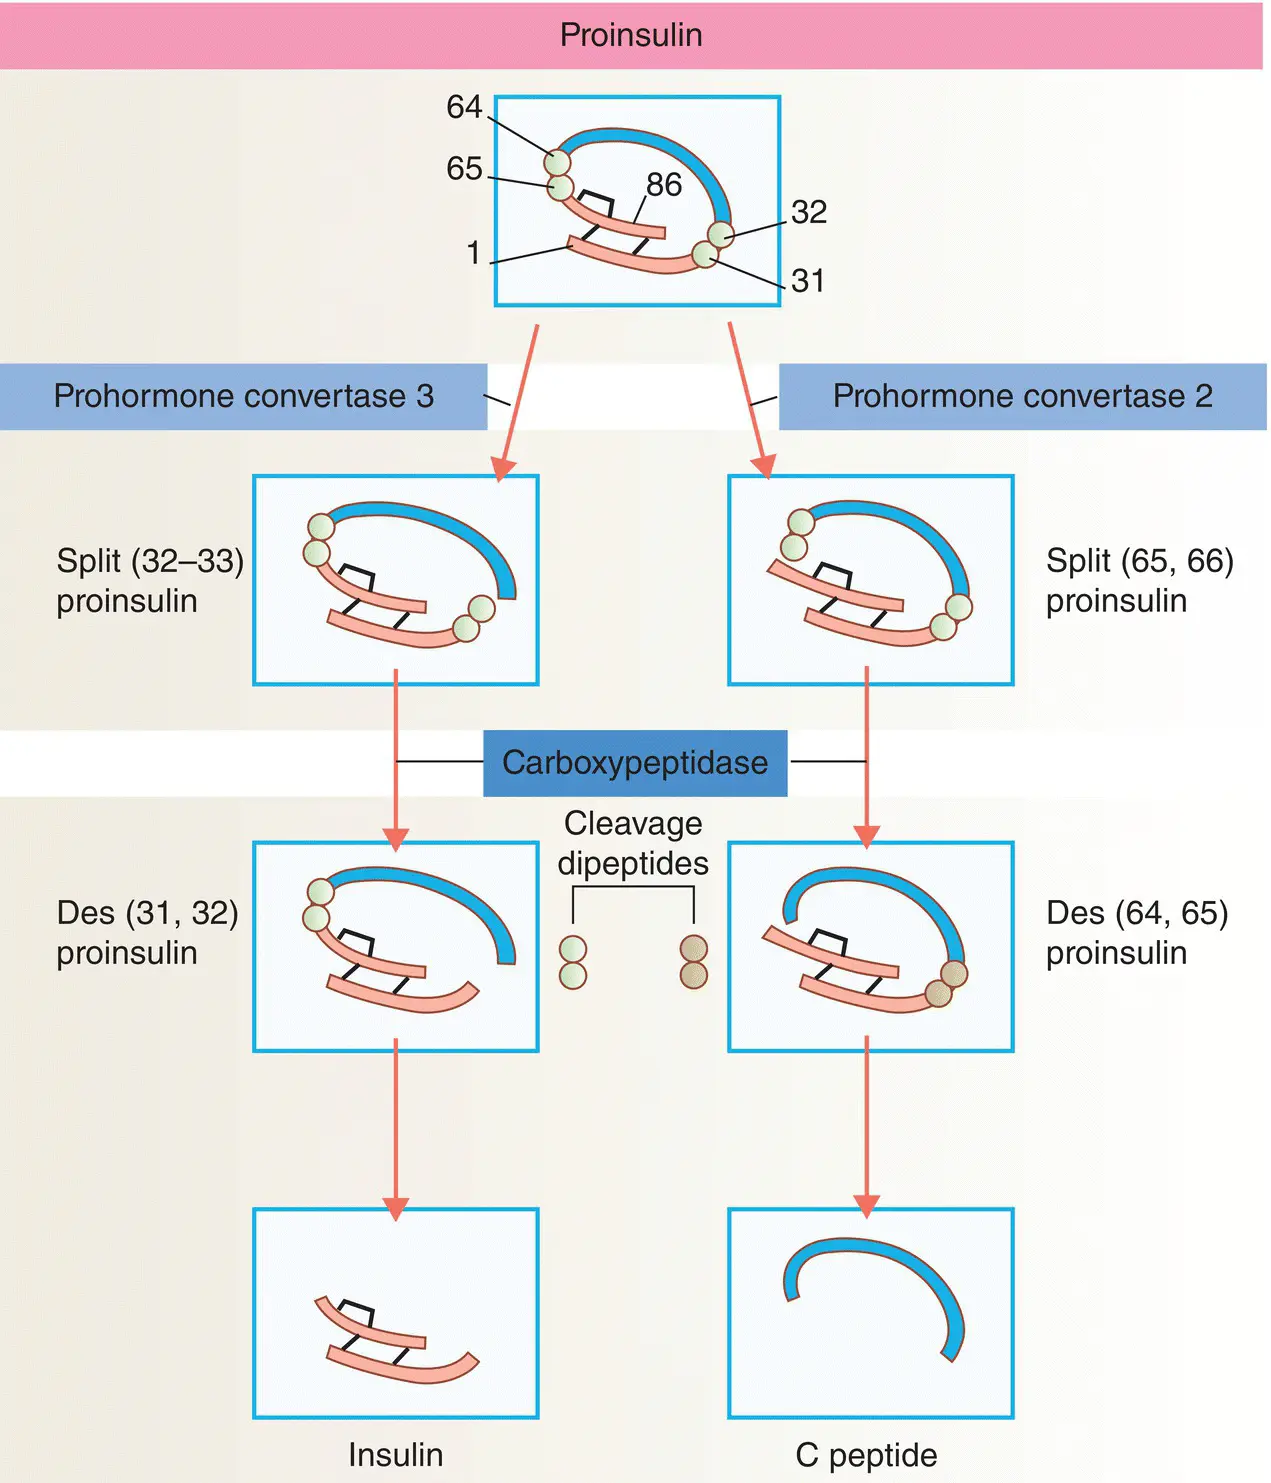
Figure 5.8 Insulin biosynthesis and processing. Proinsulin is cleaved on the C‐terminal side of two dipeptides. The cleavage dipeptides are liberated, so yielding the ‘split’ proinsulin products and ultimately insulin and C‐peptide.
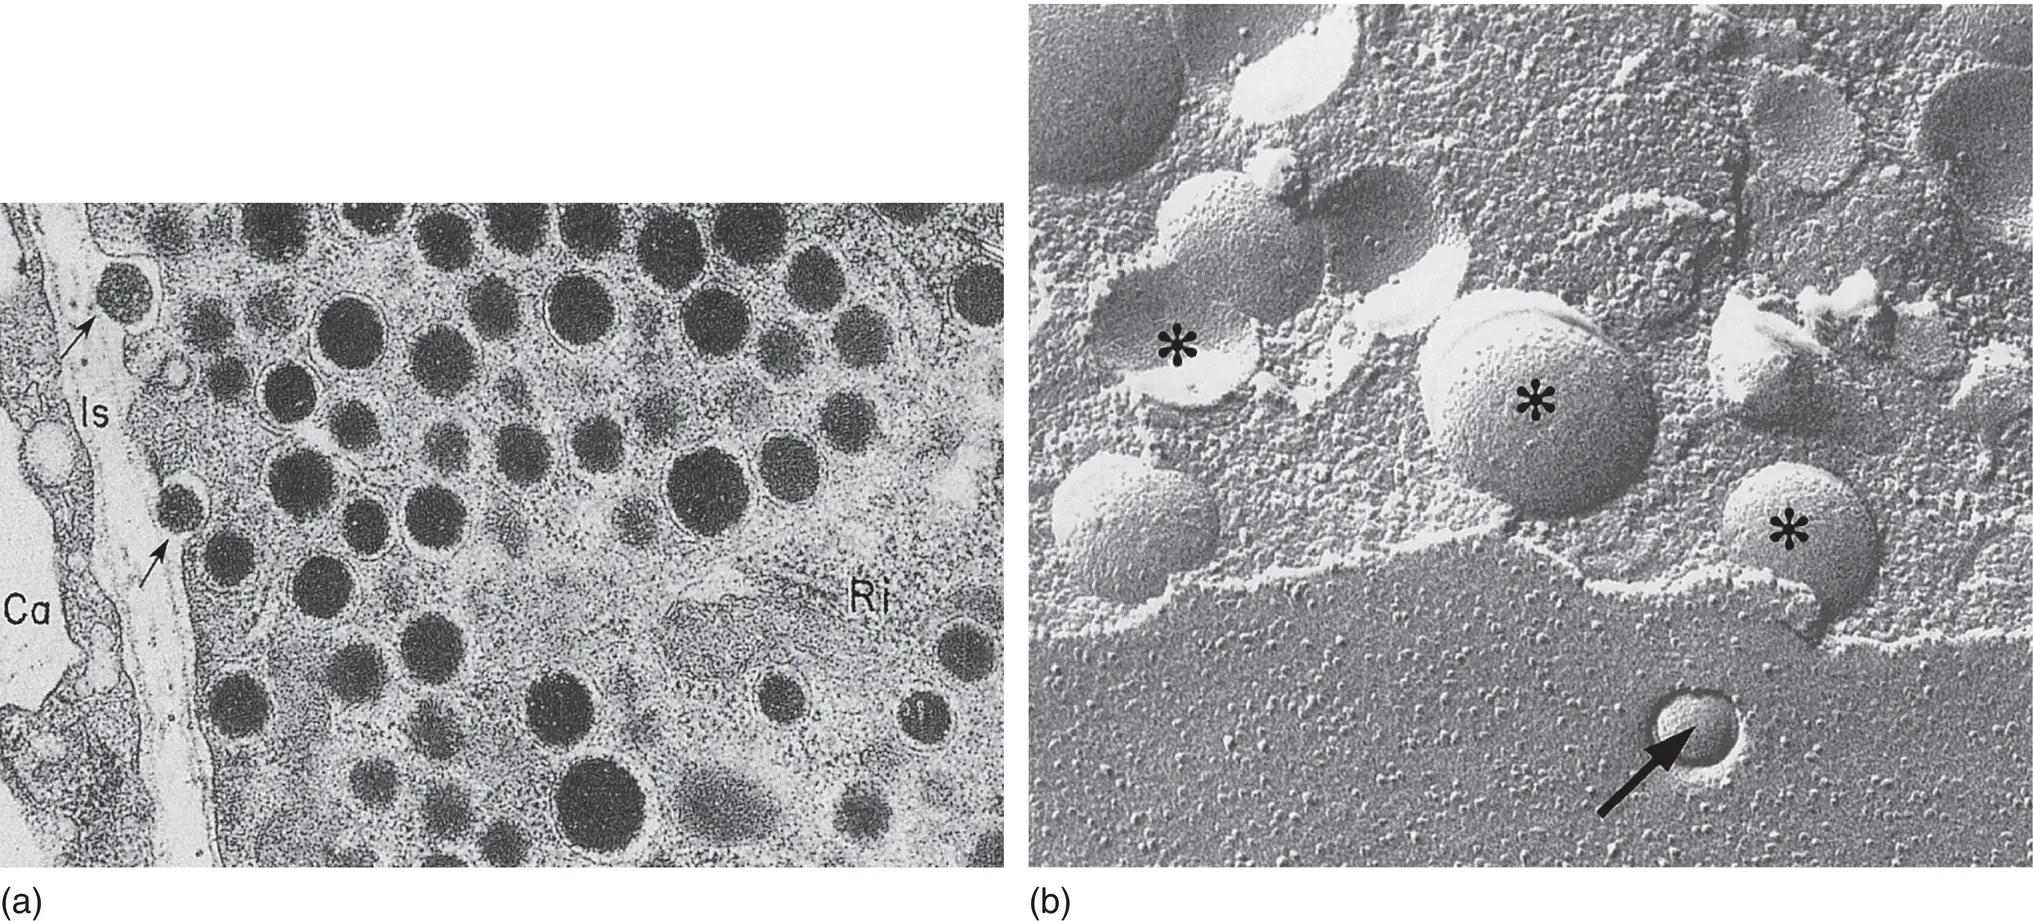
Figure 5.9 (a) Electron micrograph of insulin secretory granules in a pancreatic β cell and their secretion by exocytosis. Arrows show exocytosis occurring. Ca, capillary lumen; Is, interstitial space. (b) Freeze‐fracture views of β cells that reveal the secretory granules in the cytoplasm ( asterisks ) and the granule content released by exocytosis at the cell membrane ( arrows ). Magnification: ×52,000.
From Orci. Diabetologia 1974; 10: 163–187.
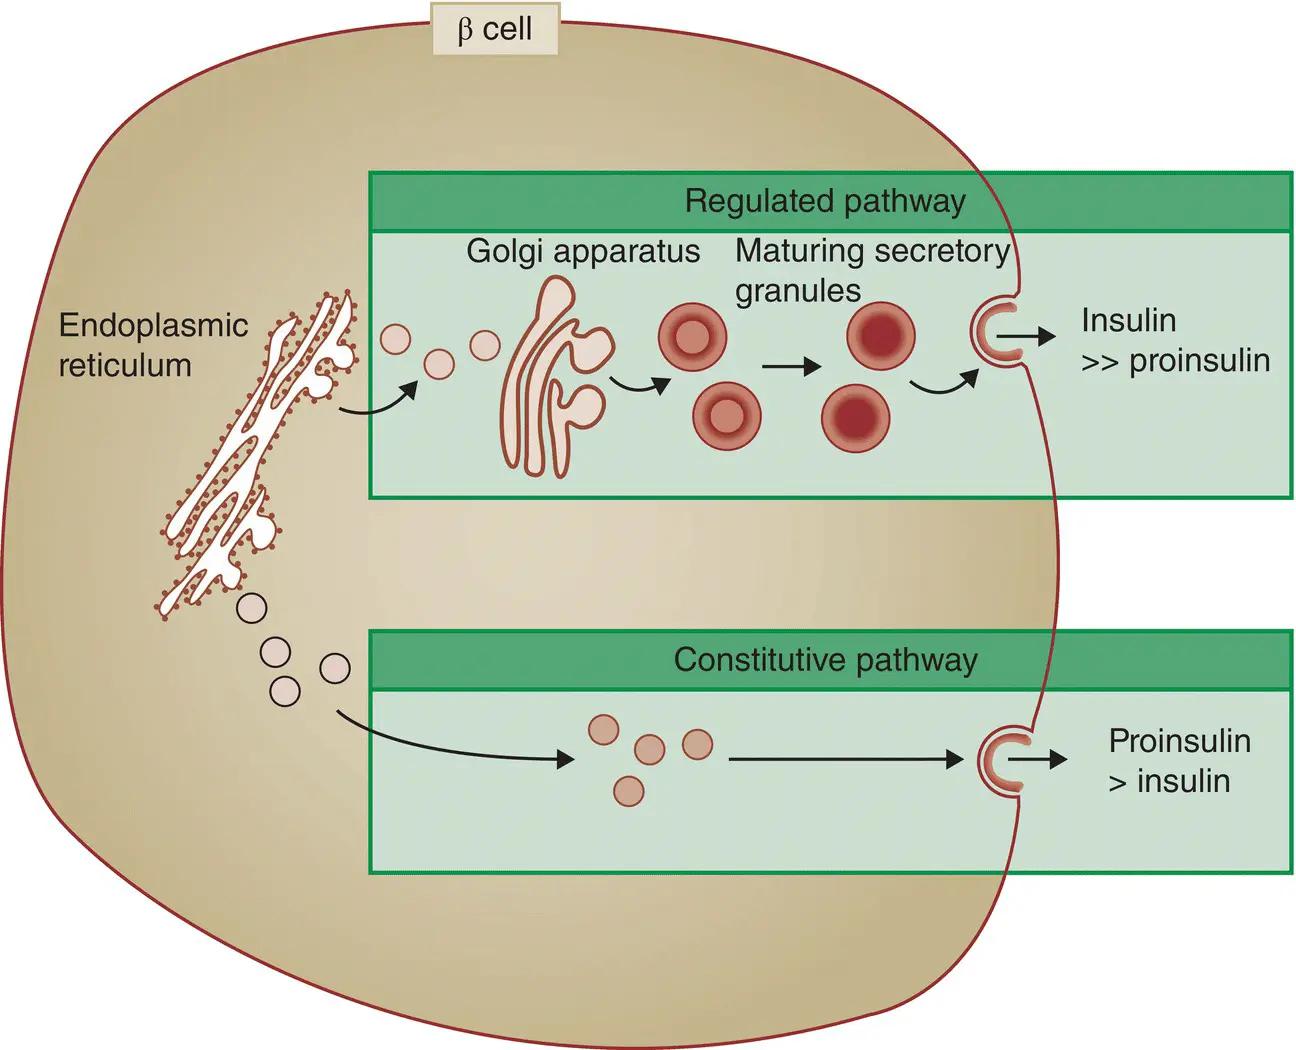
Figure 5.10 The regulated (normal) and constitutive (active in type 2 diabetes) pathways of insulin processing.
Insulin secretion
Glucose is the main stimulator of insulin release from the β cells, and insulin secretion occurs in a characteristic biphasic pattern – an immediate ‘first phase’ response that lasts only a few minutes, followed by a more gradual sustained ‘second phase’ ( Figure 5.11). The first phase of insulin release involves a small, readily releasable pool of granules fusing with the plasma membrane. Of particular importance is the observation that first‐phase insulin secretion is lost in patients with type 2 diabetes.
Various types of fuels, hormones, and neurotransmitters regulate insulin secretion. Glucose is the most important regulator and glucose stimulates insulin secretion by mechanisms that depend upon the metabolism of glucose and other nutrients in the β cells. A triggering pathway involves closure of ATP‐sensitive potassium channels (K ATPchannels), cellular depolarisation, an influx of calcium through voltage‐dependent calcium channels and an increase in intracellular calcium concentration. Simultaneously, a metabolic amplifying pathway augments the stimulatory effect of calcium on the exocytosis of insulin‐containing granules. The second messenger cAMP is an important amplifier of insulin secretion triggered by Ca 2+elevation in the β cells.
Glucose enters the β cell by facilitated diffusion via GLUT‐2 transporters. It is then phosphorylated by the enzyme glucokinase, which acts as the ‘glucose sensor’ that couples insulin secretion to the prevailing glucose concentration ( Figure 5.12). Glycolysis and mitochondrial metabolism of glucose produce adenosine triphosphate (ATP), which leads to the closure of the K ATPchannels. This in turn causes depolarisation of the β cell plasma membrane, leading to an influx of extracellular calcium through cell‐surface voltage‐gated channels. The increase in cytosolic calcium triggers translocation of insulin granules and exocytosis.
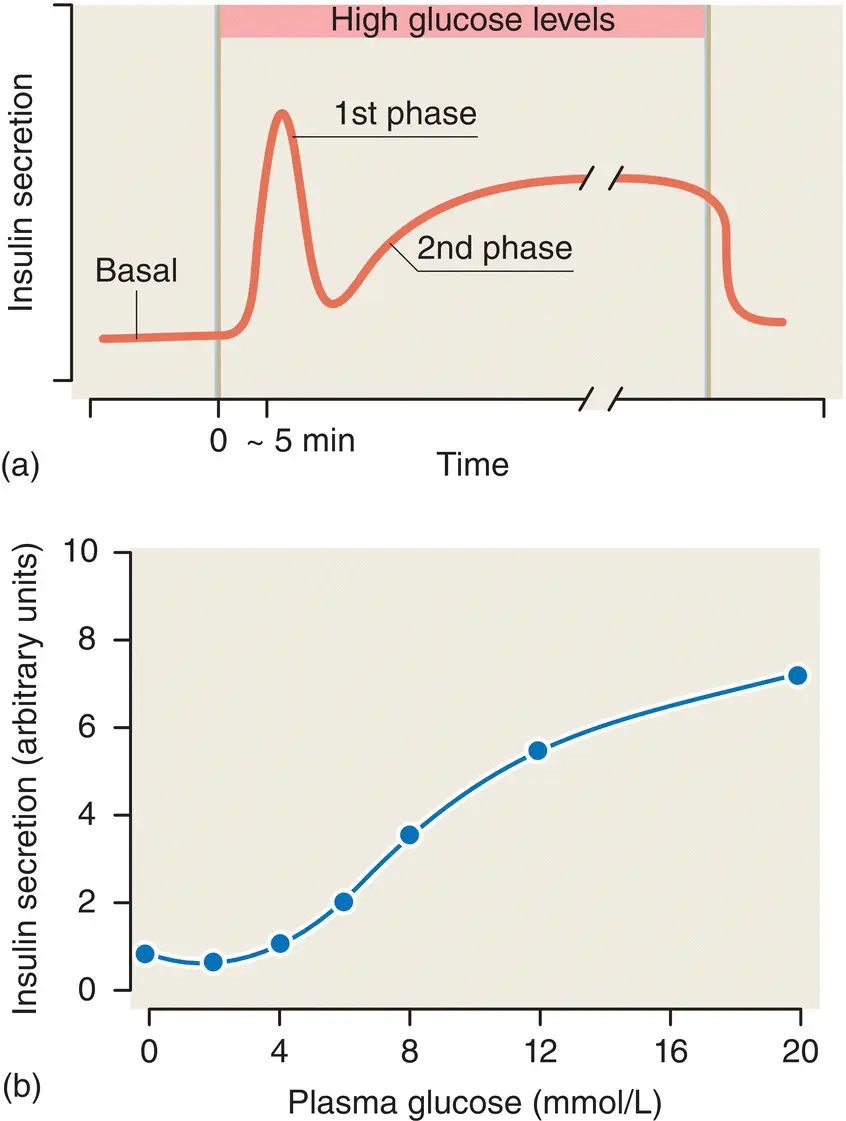
Figure 5.11 (a) The biphasic glucose‐stimulated release of insulin from pancreatic islets. (b) The glucose–insulin dose–response curve for islets of Langerhans.

Figure 5.12 The mechanism of glucose‐stimulated insulin secretion from the β cell. The structure of the KATP channel is shown in the inset.
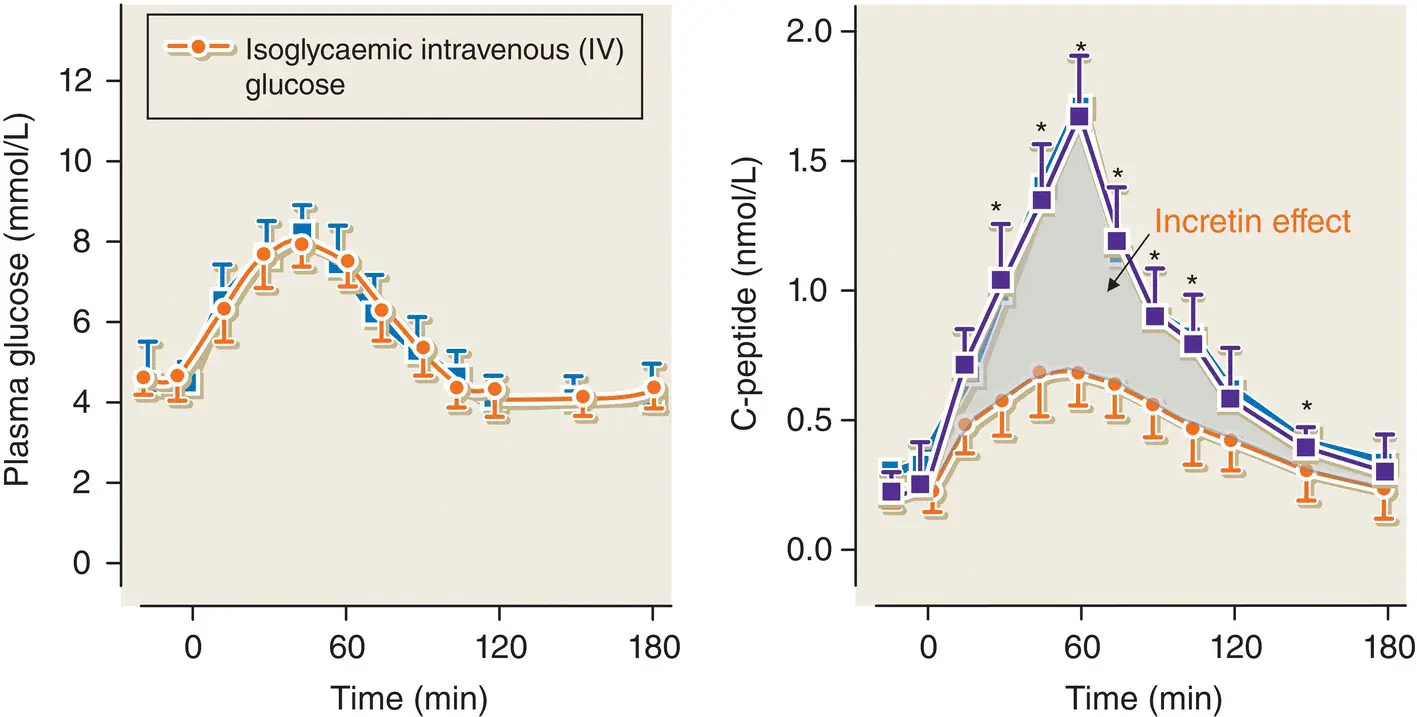
Figure 5.13 The classic experiment illustrating the incretin effect in normal subjects who were studied on two separate occasions. On one occasion, they were given an oral glucose load and on the second occasion an IV glucose bolus was administered in order to achieve identical venous plasma glucose concentration‐time profiles on the two study days (left panel). The insulin secretory response (shown by C‐peptide) was significantly greater after oral compared with IV glucose (right panel).
Adapted from Nauck et al. J Clin Endocrinol Me tab 1986; 63: 492–498.
Sulfonylureas stimulate insulin secretion by binding to a component of the K ATPchannel (the sulfonylurea receptor, SUR‐1) and closing it. The K ATPchannel is an octamer that consists of four K +‐channel subunits (called Kir6.2) and four SUR‐1 subunits.
The incretin effect
There is a significant difference between the insulin secretory response to oral glucose compared with the response to intravenous glucose – a phenomenon known as the ‘incretin effect’ ( Figure 5.13). The incretin effect is mediated by gut‐derived hormones, released in response to the ingestion of food, which augment glucose‐stimulated insulin release. In particular, there are two incretin hormones: glucagon‐like peptide‐1 (GLP‐1) and gastric inhibitory polypeptide (GIP). Both augment insulin secretion in a dose‐dependent fashion. GLP‐1 is secreted by L cells and GIP is secreted by K cells in the wall of the upper jejunum.
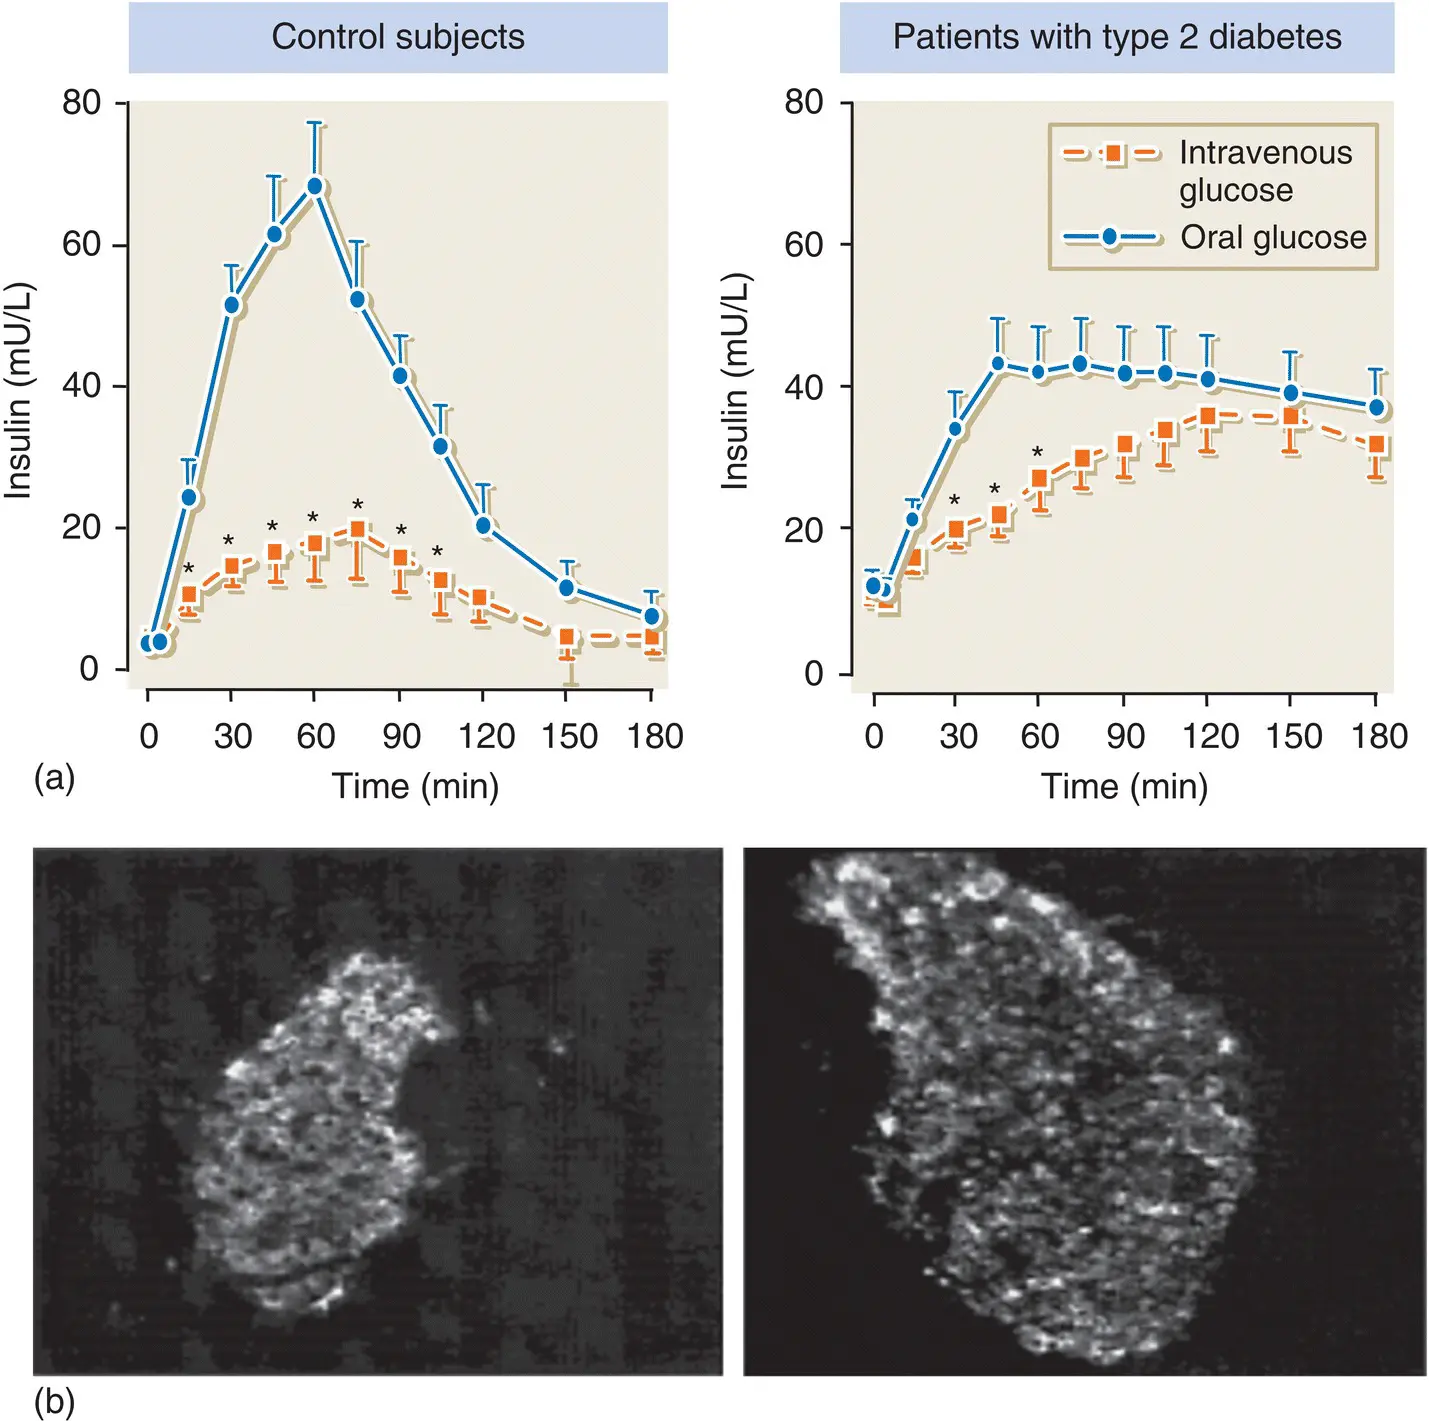
Figure 5.14 (a) The incretin effect is greatly diminished in patients with type 2 diabetes compared with normal subjects. This contributes to the impaired insulin secretory response observed in type 2 diabetes. (b) GLP‐1 has a trophic effect on pancreatic islets. Shown here is an islet from a db/db mouse before ( left ) and after ( right ) 2 weeks treatment with synthetic GLP‐1.
Adapted from Stoffers et al. Diabetes 2000; 49: 741–748.
In patients with type 2 diabetes, GLP‐1 secretion is diminished ( Figure 5.14). However, in contrast to GIP, GLP‐1 retains most of its insulinotropic activity. GIP secretion is maintained in type 2 diabetes, but its effect on the β cell is greatly reduced.
GLP‐1 also suppresses glucagon secretion from pancreatic α cells and exerts additional effects on satiety and gastric emptying. There is also considerable interest in the trophic effects of GLP‐1 on β cells.
Insulin receptor signalling
Insulin exerts its main biological effects by binding to a cell surface insulin receptor, a glycoprotein that consists of two extracellular α subunits and two transmembrane β subunits. The receptor has tyrosine kinase enzyme activity (residing in the β subunits), which is stimulated when insulin binds to the receptor. The tyrosine kinase domain phosphorylates tyrosine amino acid residues on various intracellular proteins, such as insulin receptor substrate (IRS)‐1 and IRS‐2, and the β subunit itself ( Figure 5.15) (autophosphorylation). The tyrosine kinase activity of the insulin receptor is essential for insulin action.
Post‐receptor downstream signalling events are complex but insulin binding to its receptor leads to phosphorylation of a number of intracellular proteins including IRS‐1 and IRS‐2 ( Figure 5.16). Phosphorylated tyrosine residues on these proteins act as docking sites for the non‐covalent binding of proteins with specific ‘SH2’ domains, such as phospatidylinositol 3‐kinase (PI 3‐kinase), Grb2 and phosphotyrosine phosphatase (SHP2). Binding of Grb2 to IRS‐1 initiates a cascade that eventually activates nuclear transcription factors via activation of the proteins Ras and mitogen‐activated protein (MAP) kinase. IRS–PI 3‐kinase binding generates phospholipids that modulate other specific kinases and regulate insulin‐stimulated effects such as glucose transport, and protein and glycogen synthesis.
Читать дальшеИнтервал:
Закладка:
Похожие книги на «Handbook of Diabetes»
Представляем Вашему вниманию похожие книги на «Handbook of Diabetes» списком для выбора. Мы отобрали схожую по названию и смыслу литературу в надежде предоставить читателям больше вариантов отыскать новые, интересные, ещё непрочитанные произведения.


Обсуждение, отзывы о книге «Handbook of Diabetes» и просто собственные мнения читателей. Оставьте ваши комментарии, напишите, что Вы думаете о произведении, его смысле или главных героях. Укажите что конкретно понравилось, а что нет, и почему Вы так считаете.