Salivary Gland Pathology
Здесь есть возможность читать онлайн «Salivary Gland Pathology» — ознакомительный отрывок электронной книги совершенно бесплатно, а после прочтения отрывка купить полную версию. В некоторых случаях можно слушать аудио, скачать через торрент в формате fb2 и присутствует краткое содержание. Жанр: unrecognised, на английском языке. Описание произведения, (предисловие) а так же отзывы посетителей доступны на портале библиотеки ЛибКат.
- Название:Salivary Gland Pathology
- Автор:
- Жанр:
- Год:неизвестен
- ISBN:нет данных
- Рейтинг книги:3 / 5. Голосов: 1
-
Избранное:Добавить в избранное
- Отзывы:
-
Ваша оценка:
Salivary Gland Pathology: краткое содержание, описание и аннотация
Предлагаем к чтению аннотацию, описание, краткое содержание или предисловие (зависит от того, что написал сам автор книги «Salivary Gland Pathology»). Если вы не нашли необходимую информацию о книге — напишите в комментариях, мы постараемся отыскать её.
now features case presentations to place the information in context, as well as additional treatment algorithms in each chapter to assist in clinical decision making. Written by highly respected clinicians, educators, and researchers with extensive expertise in oral and maxillofacial surgery, this authoritative resource:
Reviews the etiology, diagnosis, and treatment of all salivary gland pathologies, with detailed explanations and hundreds of full-color clinical images Incorporates new information on the taxonomy of salivary gland tumors, neoplastic and non-neoplastic entities, image guided biopsies of salivary gland lesions, and complications in traditional and non-traditional forms of salivary gland surgery Offers expanded coverage of histopathology, including classification, grading, and staging of salivary gland tumors Features up-to-date chapters on anatomy and physiology, imaging, cysts, systemic diseases, tumors, trauma, and innovative salivary gland surgical techniques Includes a discussion of meta-analyses and systematic reviews to support evidence-based practice remains the definitive resource for oral and maxillofacial surgeons, otolaryngologists, head and neck surgeons, and general surgeons as well as their residents providing care for patients with salivary gland pathology.
Salivary Gland Pathology — читать онлайн ознакомительный отрывок
Ниже представлен текст книги, разбитый по страницам. Система сохранения места последней прочитанной страницы, позволяет с удобством читать онлайн бесплатно книгу «Salivary Gland Pathology», без необходимости каждый раз заново искать на чём Вы остановились. Поставьте закладку, и сможете в любой момент перейти на страницу, на которой закончили чтение.
Интервал:
Закладка:
Advanced computed tomography
Newer CT techniques including CT perfusion and dynamic contrast‐enhanced multi‐slice CT have been studied. Dynamic multi‐slice contrast‐enhanced CT is obtained while scanning over a region of interest and simultaneously administering IV contrast. The characteristics of tissues can then be studied as the contrast bolus arrives at the lesion and “washes in” to the tumor, reaches a peak presence within the mass, and then decreases over time, i.e. “washes out.” This technique has demonstrated differences in various histologic types of tumors, for example, with early enhancement in Warthin's tumor with a time to peak at 30 seconds and subsequent fast washout. The malignant tumors show a time to peak at 90 seconds. The pleomorphic adenomas demonstrate a continued rise in enhancement in all four phases (Yerli et al. 2007).
CT perfusion attempts to study physiologic parameters of blood volume, blood flow, mean transit time, and capillary permeability surface product. Statistically significant differences between malignant and benign tumors have been demonstrated with the mean transit time measurement. A rapid mean transit time of less than 3.5 seconds is seen with most malignant tumors, but with benign tumors or normal tissue the mean transit time is significantly longer (Rumboldt et al. 2005).
MAGNETIC RESONANCE IMAGING (MRI)
Magnetic resonance imaging (MRI) represents imaging technology with great promise in characterizing salivary gland pathology. The higher tissue contrast of MRI, when compared to CT, enables subtle differences in soft tissues to be demonstrated. Gadolinium contrast‐enhanced MRI further accentuates the soft‐tissue contrast. Subtle pathologic states such as perineural spread of disease are better delineated when compared with CT. This along with excellent resolution and exquisite details make MRI a very powerful technique in head and neck imaging, particularly at the skull base. This notwithstanding, its susceptibility to motion artifacts and long imaging time as well as contraindication due to claustrophobia, pacemakers, aneurysm clips, deep brain and vagal nerve stimulators limit its usefulness in the general population as a routine initial diagnostic and follow‐up imaging modality. Many of the safety considerations are well defined and detailed on the popular website, www.mrisafety.com.
MRI Technique
Although the physics and instrumentation of MRI are beyond the scope of this text, a fundamental understanding of the variety of different imaging sequences and techniques should be understood by clinicians to facilitate reciprocal communication of the clinical problem, and understanding of imaging reports.
In contrast to CT, which is based on the use of ionizing radiation, MRI utilizes a high magnetic field and pulsed radiofrequency waves to create an image or obtain spectroscopic data. MRI is based on the proton (hydrogen ion) distribution throughout the body. The basic concept is that protons are normally oriented in a random state. However, once placed in the imaging magnet, a high magnetic field, a large proportion of protons align with the magnetic field. The protons remain aligned and precess (spin) in the magnetic field until an external force acts upon them and forces them out of alignment. This force is an applied radiofrequency pulse, applied for a specified time and specified frequency by an antenna called a transmit coil. As the protons return to the aligned state, they give off energy in the form of their own radiofrequency pulse, determined by their local chemical state and tissue structure. The radiofrequency pulse given off is captured by an antenna, called a receive coil. The energy of the pulse and location are recorded and the process repeated multiple times and averaged, as the signal is weak. The recorded signal is used to form the image. Several different types of applied pulse sequences of radio waves result in different types of images.
The impact of MRI is in the soft‐tissue contrast that can be obtained, noninvasively. The relaxation times of tissues can be manipulated to bring out soft‐tissue detail. The routine sequences used in clinical scanning are spin‐echo (SE), gradient echo (GRE), and echo‐planar (EPI). Typical pulse sequences for head and neck and brain imaging include spin‐echo T1, spin‐echo T2, proton density (PD), fluid attenuation inversion recovery (FLAIR), diffusion weighted images (DWI), post‐contrast T1 and STIR. A variant of the spin‐echo, the fast spin‐echo sequence (FSE) allows for a more rapid acquisition of spin‐echo images. Any one of these can be obtained in the three standard orientations of axial, coronal, and sagittal planes. Oblique planes may be obtained in special circumstances.
Spin‐echo T1
On T1 weighted images, a short repetition time (tr) and short echo time (te) are applied resulting in an image commonly used for anatomic depiction. Water signal is very low and is displayed as dark gray to black pixels on the gray scale. Fat is very bright, allowing tissue planes to be delineated. Fast flowing blood is devoid of signal and is therefore very black. Muscle tissue is an intermediate gray. Bone which has few free protons is also largely devoid of signal. Bone marrow, however, will vary depending on the relative percentage of red versus yellow marrow. Red marrow will have a signal slightly lower than muscle, whereas yellow marrow (fat replaced) will be bright. In the brain, cerebrospinal fluid (CSF) is dark, and flowing blood is black. Gray matter is dark relative to white matter (contains fatty myelin) but both are higher than cerebrospinal fluid (CSF) but less than fat. Cysts (simple) are dark in signal unless they are complicated by hemorrhage or infection or have elevated protein concentration, which results in an increased signal and slightly brighter display ( Figure 2.8) ( Table 2.2).
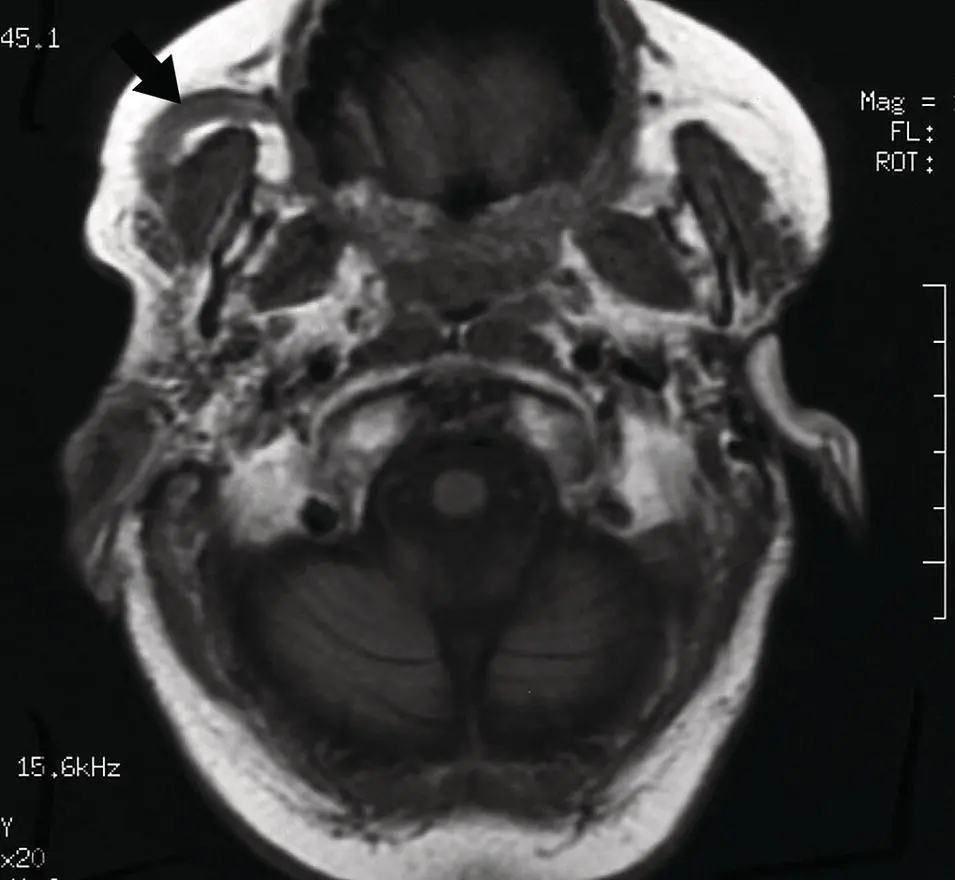
Figure 2.8. Axial MRI T1 weighted image at level of the skull base and brainstem without contrast demonstrating high signal in the subcutaneous fat, intermediate signal of the brain, and low signal of the CSF and mucosa. Note dilated right parotid duct (arrow).
Spin‐echo T2
The T2 images are obtained with a long tr and te. The T2 image is sensitive to the presence of water in tissues and depicts edema as a very bright signal. Therefore, CSF or fluid containing structures such as cysts is very bright. Complicated cysts can vary in T2 images. If hemorrhagic, they can have heterogenous or even uniformly dark signal caused by a susceptibility artifact. These artifacts can be caused by metals, melanin, forms of calcium and the iron in hemoglobin. Increased tissue water from edema stands out as bright relative to the isointense soft tissue. The fast spin‐echo T2 is a common sequence, which is many times faster than the conventional spin‐echo T2 but does alter the image. Fat stays brighter on the fast spin‐echo (FSE) sequence relative to the conventional ( Figure 2.9) ( Table 2.2).
Proton density images (PD)
Proton density images are obtained with a long tr but short te, resulting in an image with less tissue contrast but high signal‐to‐noise ratio. These are uncommonly used in the head and neck.
Table 2.2. Tissue characteristics on T1 and T2 MRI. a
| T1 | T2 | |
| Increased signal | FatCalcium b Proteinaceous fluid (high) c Slow flowing bloodMelaninHyperacute hemorrhage d (oxyhemoglobin)Subacute hemorrhage (intracellular and extracellular methemoglobin)Gadolinium contrastManganeseCholesterol | Water (CSF) or edemaProteinaceous fluidHyperacute hemorrhage (oxyhemoglobin)Subacute hemorrhage (extracellular methemoglobin)Slow flowing bloodFat (FSE T2 scans) |
| Intermediate signal | Hyperacute hemorrhage (oxyhemoglobin)Acute hemorrhage (deoxyhemoglobin)Calcium b Gray matterWhite matter (brighter than gray matter)Soft tissue (muscle)Proteinaceous fluid c | Grey matter (brighter than white matter)White matterProteinaceous fluid c Calcium b |
| Decreased signal | Water (CSF) or edemaFast flowing bloodCalcium b Soft tissueAcute hemorrhage (deoxyhemoglobin)Chronic hemorrhage (hemosiderin)CalcificationAirSimple cyst (low protein) | Calcium b MelaninHemosiderinFlowing bloodhemorrhagic cystIron depositionAcute hemorrhage (deoxyhemoglobin)Early subacute hemorrhage (intracellular methemoglobin)Chronic hemorrhage (hemosiderin)AirFast flowFat (conventional or non‐FSE T2 scan) |
a MRI signal on T1 and T2 predominantly from intracranial exam at 1.5T (Tesla).
Читать дальшеИнтервал:
Закладка:
Похожие книги на «Salivary Gland Pathology»
Представляем Вашему вниманию похожие книги на «Salivary Gland Pathology» списком для выбора. Мы отобрали схожую по названию и смыслу литературу в надежде предоставить читателям больше вариантов отыскать новые, интересные, ещё непрочитанные произведения.


Обсуждение, отзывы о книге «Salivary Gland Pathology» и просто собственные мнения читателей. Оставьте ваши комментарии, напишите, что Вы думаете о произведении, его смысле или главных героях. Укажите что конкретно понравилось, а что нет, и почему Вы так считаете.