Machine Learning Algorithms and Applications
Здесь есть возможность читать онлайн «Machine Learning Algorithms and Applications» — ознакомительный отрывок электронной книги совершенно бесплатно, а после прочтения отрывка купить полную версию. В некоторых случаях можно слушать аудио, скачать через торрент в формате fb2 и присутствует краткое содержание. Жанр: unrecognised, на английском языке. Описание произведения, (предисловие) а так же отзывы посетителей доступны на портале библиотеки ЛибКат.
- Название:Machine Learning Algorithms and Applications
- Автор:
- Жанр:
- Год:неизвестен
- ISBN:нет данных
- Рейтинг книги:4 / 5. Голосов: 1
-
Избранное:Добавить в избранное
- Отзывы:
-
Ваша оценка:
Machine Learning Algorithms and Applications: краткое содержание, описание и аннотация
Предлагаем к чтению аннотацию, описание, краткое содержание или предисловие (зависит от того, что написал сам автор книги «Machine Learning Algorithms and Applications»). Если вы не нашли необходимую информацию о книге — напишите в комментариях, мы постараемся отыскать её.
Machine Learning Algorithms and Applications — читать онлайн ознакомительный отрывок
Ниже представлен текст книги, разбитый по страницам. Система сохранения места последней прочитанной страницы, позволяет с удобством читать онлайн бесплатно книгу «Machine Learning Algorithms and Applications», без необходимости каждый раз заново искать на чём Вы остановились. Поставьте закладку, и сможете в любой момент перейти на страницу, на которой закончили чтение.
Интервал:
Закладка:
Figure 1.12shows the predicted values of O3 for Anand Vihar, New Delhi in December, 2017, and decline in O3 levels can be observed. Figure 1.13shows the predicted values of PM10 for Sector 62, Noida in June, 2020, and decline in levels could be observed.
The quality of air as shown in Figure 1.14could also be observed/predicted for the major cities of India. This helped the user to study the quality of air throughout the country. The figure shows the quality of air as severe (magenta), very poor (yellow), poor (cyan), moderate (red), satisfactory (green), and good as blue dot on the map. It was realized that smaller cities, towns, and villages in India have good air quality. It is only the Metropolitan cities and the areas surrounding these cities that suffer from worst air quality.
From our project, we had some major findings. It was found that the values of different parameters of air depend on the latest past records (few days to a month) and not on many previous months. While retrieving real-time values through API for different parameters, sometimes, null or zero values occur. This might be due to malfunctioning of the sensors or inappropriate weather conditions. Zero or very less values might also occur at night because of the fact that certain parameters like O3 mix with other chemical compounds to form other compounds and consequently their value reduces. No2 and SO2 are also sometimes interacting and hence their abrupt values. The raw data is much easier to understand through visualizations for a common man. Also, lockdown is expected to be the effective alternative measure to be implemented for controlling air pollution.
Figure 1.3 Screenshot of fetched data.
Table 1.2 Precision, recall, and F1-score.
| Classes | Precision | Recall | F1-Score |
| Moderate | 1.0 | 0.99 | 0.99 |
| Poor | 1.0 | 0.95 | 0.97 |
| Satisfactory | 0.98 | 1.0 | 0.99 |
| Severe | 1.0 | 1.0 | 1.0 |
| Very Poor | 1.0 | 1.0 | 1.0 |
| Avg/total | 0.99 | 0.99 | 0.99 |
| Final Accuracy: 0.9893 |
Table 1.3 MAE and RMSE scores for different epochs.
| Test MAE for 1 | 8.864 |
| Test RMSE for 1 | 12.122 |
| Test MAE for 2 | 17.996 |
| Test RMSE for 2 | 35.390 |
| Test MAE for 3 | 23.820 |
| Test RMSE for 3 | 35.938 |
| Test MAE for 4 | 6.021 |
| Test RMSE for 4 | 9.269 |
Figure 1.4 Predicted values in Bengaluru in December, 2017.

Figure 1.5 Predicted values in Bengaluru in June, 2020.
Figure 1.6 Predicted values in New Delhi in December, 2017.
Figure 1.7 Predicted values in New Delhi in June, 2020.
Table 1.4 MAE scores for LSTM hyper parameters.
| Batch size | Epochs | NO2 | O3 | PM10 | PM2.5 | SO2 |
| 10 | 10 | 22 | 52 | 142 | 64 | 14 |
| 24 | 100 | 17 | 22 | 142 | 52 | 13 |
| 15 | 100 | 13 | 19 | 139 | 51 | 13 |
| 8 | 10 | 16.8 | 25.4 | 124 | 44.8 | 13 |
| 6 | 10 | 13 | 25 | 119.7 | 44 | 13 |
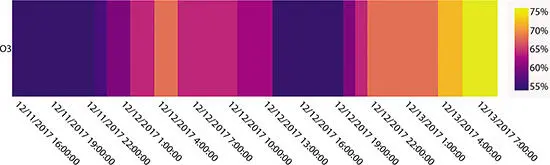
Figure 1.8 Heat map for ozone O 3for day and night in December, 2017.
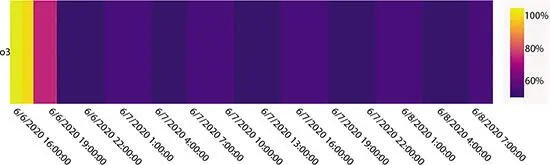
Figure 1.9 Heat map for ozone O 3for day and night in June, 2020.
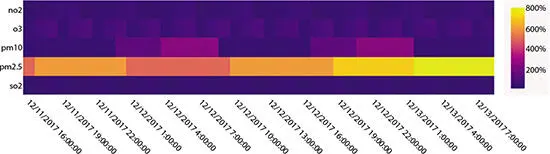
Figure 1.10 Heat map for all parameters for 3 days and nights in December, 2017.
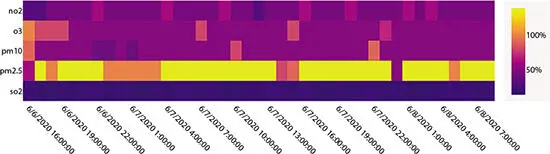
Figure 1.11 Heat map for all parameters for 3 days and nights in June, 2020.
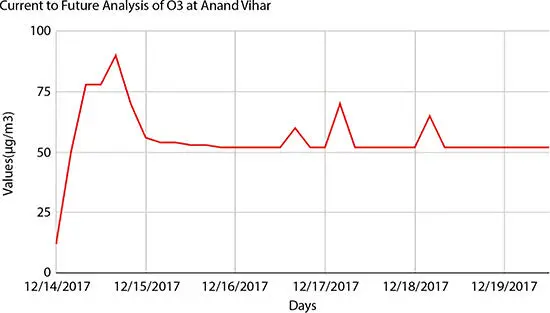
Figure 1.12 Predicted values for O 3for Anand Vihar, New Delhi.
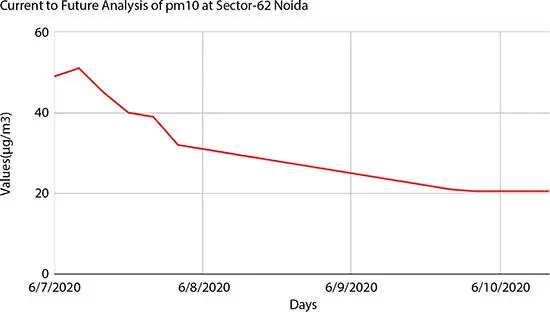
Figure 1.13 Predicted values for PM 10for Sector 62, Noida.
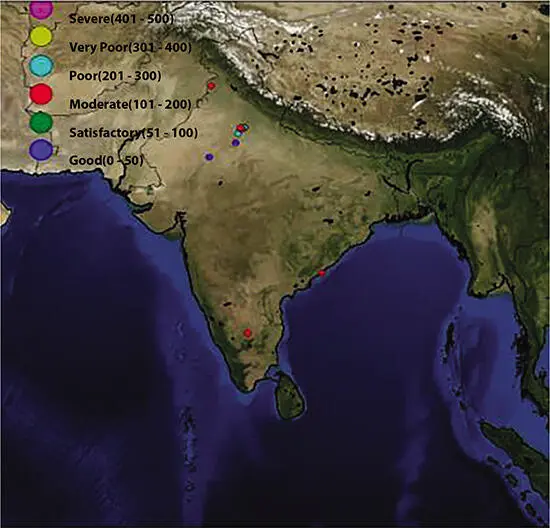
Figure 1.14 Pollution levels in major Indian cities.
1.5 Conclusion
After applying K-means clustering using Silhouette coefficient, the data is divided into seven clusters. The SVM is successfully able to classify the data into its respective air quality class with accuracy of 99%. The LSTM models for different places have been tuned accordingly to minimize MAE and RMSE. The proposed model could be used for various purposes like predicting future trends of air quality, assessing past trends of air quality, visualizing data in an effective way, issuing health advisory, and providing health effects (if any) based on the current air quality. Various parameters can be compared and it could be determined which pollutant is affecting more in a particular area and accordingly actions could be taken beforehand. Anyone could get inference from the data easily which is tough to analyze numerically and could take certain actions to control air pollution in any area.
References
1. IHME and HEI State of Global Air/2017, A special report on global exposure to air pollution and its disease burden. State of Global Air, vol. 1, 1–17, 2017.
Читать дальшеИнтервал:
Закладка:
Похожие книги на «Machine Learning Algorithms and Applications»
Представляем Вашему вниманию похожие книги на «Machine Learning Algorithms and Applications» списком для выбора. Мы отобрали схожую по названию и смыслу литературу в надежде предоставить читателям больше вариантов отыскать новые, интересные, ещё непрочитанные произведения.


Обсуждение, отзывы о книге «Machine Learning Algorithms and Applications» и просто собственные мнения читателей. Оставьте ваши комментарии, напишите, что Вы думаете о произведении, его смысле или главных героях. Укажите что конкретно понравилось, а что нет, и почему Вы так считаете.