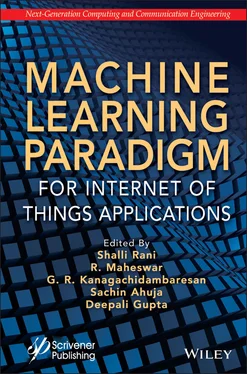
Machine Learning Paradigm for Internet of Things Applications
Здесь есть возможность читать онлайн «Machine Learning Paradigm for Internet of Things Applications» — ознакомительный отрывок электронной книги совершенно бесплатно, а после прочтения отрывка купить полную версию. В некоторых случаях можно слушать аудио, скачать через торрент в формате fb2 и присутствует краткое содержание. Жанр: unrecognised, на английском языке. Описание произведения, (предисловие) а так же отзывы посетителей доступны на портале библиотеки ЛибКат.
- Название:Machine Learning Paradigm for Internet of Things Applications
- Автор:
- Жанр:
- Год:неизвестен
- ISBN:нет данных
- Рейтинг книги:4 / 5. Голосов: 1
-
Избранное:Добавить в избранное
- Отзывы:
-
Ваша оценка:
- 80
- 1
- 2
- 3
- 4
- 5
Machine Learning Paradigm for Internet of Things Applications: краткое содержание, описание и аннотация
Предлагаем к чтению аннотацию, описание, краткое содержание или предисловие (зависит от того, что написал сам автор книги «Machine Learning Paradigm for Internet of Things Applications»). Если вы не нашли необходимую информацию о книге — напишите в комментариях, мы постараемся отыскать её.
As companies globally realize the revolutionary potential of the IoT, they have started finding a number of obstacles they need to address to leverage it efficiently. Many businesses and industries use machine learning to exploit the IoT’s potential and this book brings clarity to the issue. Machine Learning Paradigm for Internet of Thing Applications
Machine Learning Paradigm for Internet of Things Applications — читать онлайн ознакомительный отрывок
Ниже представлен текст книги, разбитый по страницам. Система сохранения места последней прочитанной страницы, позволяет с удобством читать онлайн бесплатно книгу «Machine Learning Paradigm for Internet of Things Applications», без необходимости каждый раз заново искать на чём Вы остановились. Поставьте закладку, и сможете в любой момент перейти на страницу, на которой закончили чтение.
Интервал:
Закладка:
Table of Contents
1 Cover
2 Title Page
3 Copyright
4 Preface
5 1 Machine Learning Concept–Based IoT Platforms for Smart Cities’ Implementation and Requirements 1.1 Introduction 1.2 Smart City Structure in India 1.3 Status of Smart Cities in India 1.4 Analysis of Smart City Setup 1.5 Ideal Planning for the Sewage Networking Systems 1.6 Heritage of Culture Based on Modern Advancement 1.7 Funding and Business Models to Leverage 1.8 Community-Based Development 1.9 Revolutionary Impact With Other Locations 1.10 Finding Balanced City Development 1.11 E-Industry With Enhanced Resources 1.12 Strategy for Development of Smart Cities References
6 2 An Empirical Study on Paddy Harvest and Rice Demand Prediction for an Optimal Distribution Plan 2.1 Introduction 2.2 Background 2.3 Methodology 2.4 Results and Discussion 2.5 Conclusion References
7 3 A Collaborative Data Publishing Model with Privacy Preservation Using Group-Based Classification and Anonymity 3.1 Introduction 3.2 Literature Survey 3.3 Proposed Model 3.4 Results 3.5 Conclusion References
8 4 Production Monitoring and Dashboard Design for Industry 4.0 Using Single-Board Computer (SBC) 4.1 Introduction 4.2 Related Works 4.3 Industry 4.0 Production and Dashboard Design 4.4 Results and Discussion 4.5 Conclusion References
9 5 Generation of Two-Dimensional Text-Based CAPTCHA Using Graphical Operation 5.1 Introduction 5.2 Types of CAPTCHAs 5.3 Related Work 5.4 Proposed Technique 5.5 Text-Based CAPTCHA Scheme 5.6 Breaking Text-Based CAPTCHA’s Scheme 5.7 Implementation of Text-Based CAPTCHA Using Graphical Operation 5.8 Graphical Text-Based CAPTCHA in Online Application 5.9 Conclusion and Future Enhancement References
10 6 Smart IoT-Enabled Traffic Sign Recognition With High Accuracy (TSR-HA) Using Deep Learning 6.1 Introduction 6.2 Experimental Evaluation 6.3 Conclusion References
11 7 Offline and Online Performance Evaluation Metrics of Recommender System: A Bird’s Eye View 7.1 Introduction 7.2 Evaluation Metrics 7.3 Related Works 7.4 Experimental Setup 7.5 Summary and Conclusions References
12 8 Deep Learning–Enabled Smart Safety Precautions and Measures in Public Gathering Places for COVID-19 Using IoT 8.1 Introduction 8.2 Prelims 8.3 Proposed System 8.4 Math Model 8.5 Results 8.6 Conclusion References
13 9 Route Optimization for Perishable Goods Transportation System 9.1 Introduction 9.2 Related Works 9.3 Proposed Methodology 9.4 Proposed Work Implementation 9.5 Conclusion References
14 10 Fake News Detection Using Machine Learning Algorithms 10.1 Introduction 10.2 Literature Survey 10.3 Methodology 10.4 Experimental Results 10.5 Conclusion References
15 11 Opportunities and Challenges in Machine Learning With IoT 11.1 Introduction 11.2 Literature Review 11.3 Why Should We Care About Learning Representations? 11.4 Big Data 11.5 Data Processing Opportunities and Challenges 11.6 Learning Opportunities and Challenges 11.7 Enabling Machine Learning With IoT 11.8 Conclusion References
16 12 Machine Learning Effects on Underwater Applications and IoUT 12.1 Introduction 12.2 Characteristics of IoUT 12.3 Architecture of IoUT 12.4 Challenges in IoUT 12.5 Applications of IoUT 12.6 Machine Learning 12.7 Simulation and Analysis 12.8 Conclusion References
17 13 Internet of Underwater Things: Challenges, Routing Protocols, and ML Algorithms 13.1 Introduction 13.2 Internet of Underwater Things 13.3 Routing Protocols of IoUT 13.4 Machine Learning in IoUT 13.5 Performance Evaluation 13.6 Conclusion References
18 14 Chest X-Ray for Pneumonia Detection 14.1 Introduction 14.2 Background 14.3 Research Methodology 14.4 Results and Discussion 14.5 Conclusion Acknowledgment References
19 Index
20 End User License Agreement
List of Illustrations
1 Chapter 1 Figure 1.1 Bhubaneswar smart city structure. Figure 1.2 Pune smart city overview. Figure 1.3 Funds raised by government of India. Figure 1.4 Physical infrastructure workflow. Figure 1.5 Water supply chain in city structure. Figure 1.6 Smart city control flow for command and control centers.
2 Chapter 2 Figure 2.1 System diagram of “isRice”. Figure 2.2 Structure of RNN. Figure 2.3 Output feedback for RNN. Figure 2.4 Structure of a standard RNN cell. Figure 2.5 Structure of a standard LSTM cell. Figure 2.6 Chromosome structure. Figure 2.7 One-point crossover. Figure 2.8 Mutation: swap operator. Figure 2.9 Business model of “isRice”. Figure 2.10 “isRice” main interface. Figure 2.11 Harvest prediction interface. Figure 2.12 Demand prediction interface.Figure 2.13 MAE for train set and test set: Paddy harvest prediction.Figure 2.14 MAE for train set and test set: Rice demand prediction.Figure 2.15 Number of generations vs. fitness value.Figure 2.16 Time vs. number of consumer districts.
3 Chapter 3Figure 3.1 Data collection and publishing model.Figure 3.2 Classification accuracy.Figure 3.3 Comparison of privacy preservation rate.Figure 3.4 Data publishing security level.
4 Chapter 4Figure 4.1 Domain technologies aiding Industry 4.0.Figure 4.2 Industrial production monitoring system through IIoT.Figure 4.3 Production unit in industries.Figure 4.4 Programming chart of digital twin creation.Figure 4.5 Digital twin design of production monitoring unit.Figure 4.6 Network round trip delay time.
5 Chapter 5Figure 5.1 Example of text CAPTCHA.Figure 5.2 Image-based captcha.Figure 5.3 Confusing character in a Google CAPTCHA.Figure 5.4 Segmentation method based on individual character.Figure 5.5 Segmented CAPTCHA image.Figure 5.6 Graphical operation made CAPTCHA image.Figure 5.7 Graphical sesign CAPTCHA in online application.
6 Chapter 6Figure 6.1 CNN feature extraction structure diagram in deep learning.Figure 6.2 (a) Input image; (b) Output image. (c) Input image; (d) Output image....Figure 6.3 Smart IoT-enabled traffic signs recognizing with high accuracy using ...
7 Chapter 7Figure 7.1 Evaluation structure of recommender system.Figure 7.2 ROC-AUC curve.Figure 7.3 Types of user study.Figure 7.4 Basic structure of A/B test.Figure 7.5 Process of data mining in RS.Figure 7.6 Rating prediction through matrix factorization.Figure 7.7 Process flow of offline evaluation.Figure 7.8 Illustration of IBCF.Figure 7.9 Performance evaluation of Random vs. SVD.Figure 7.10 Performance evaluation of SVD vs. SVD++.Figure 7.11 Novelty calculation of Random, SVD, and SVD++.
8 Chapter 8Figure 8.1 Convolutional Neural Network (CNN).Figure 8.2 Dataflow diagram.Figure 8.3 Safety equipment detecting.Figure 8.4 Detecting mask using deep learning.Figure 8.5 Detecting body temperature using thermal sensor.Figure 8.6 Raspberry Pi 3 connected with smart Locking door.
9 Chapter 9Figure 9.1 Silhouette analysis on K-means clustering on sample data with n_clust...Figure 9.2 City market hub marked in red and the market locations to deliver goo...Figure 9.3 Assigned vehicle route for a key market hub.Figure 9.4 Sample output for the depot (0).
10 Chapter 10Figure 10.1 Fake news evaluation matrix.Figure 10.2 Feature extraction.Figure 10.3 Confusion matrix of logistic regression.Figure 10.4 Confusion matrix of Naïve Bayes.Figure 10.5 Confusion matrix for random forest classifier.Figure 10.6 Confusion matrix for XGBoost algorithm.Figure 10.7 Accuracy level of machine learning algorithms.Figure 10.8 ROC curve of random forest for all four classes.
11 Chapter 11Figure 11.1 The paradigm for ML on Big data (MLBiD).
12 Chapter 12Figure 12.1 Internet of Underwater Things basic model.Figure 12.2 Architecture of IoUT.Figure 12.3 Applications of IoUT.Figure 12.4 Average communication cost vs. node mobility.Figure 12.5 Energy consumption vs number of nodes.
13 Chapter 13Figure 13.1 Concept of IoUTs.Figure 13.2 Concept and devices used in IoUT.Figure 13.3 Different routing protocols in IoUT.Figure 13.4 Multipoint relays in OLSR.Figure 13.5 The relationship between S and L in GFGD.Figure 13.6 A 3D logical grid view of EMGGR protocol.Figure 13.7 The probability of ACK’s collision.Figure 13.8 Operations in DRP.Figure 13.9 Delivery ratio vs. number of nodes.Figure 13.10 Energy consumption vs. number of nodes.
Читать дальшеИнтервал:
Закладка:
Похожие книги на «Machine Learning Paradigm for Internet of Things Applications»
Представляем Вашему вниманию похожие книги на «Machine Learning Paradigm for Internet of Things Applications» списком для выбора. Мы отобрали схожую по названию и смыслу литературу в надежде предоставить читателям больше вариантов отыскать новые, интересные, ещё непрочитанные произведения.
Обсуждение, отзывы о книге «Machine Learning Paradigm for Internet of Things Applications» и просто собственные мнения читателей. Оставьте ваши комментарии, напишите, что Вы думаете о произведении, его смысле или главных героях. Укажите что конкретно понравилось, а что нет, и почему Вы так считаете.
