Lillian Pierson - Data Science For Dummies
Здесь есть возможность читать онлайн «Lillian Pierson - Data Science For Dummies» — ознакомительный отрывок электронной книги совершенно бесплатно, а после прочтения отрывка купить полную версию. В некоторых случаях можно слушать аудио, скачать через торрент в формате fb2 и присутствует краткое содержание. Жанр: unrecognised, на английском языке. Описание произведения, (предисловие) а так же отзывы посетителей доступны на портале библиотеки ЛибКат.
- Название:Data Science For Dummies
- Автор:
- Жанр:
- Год:неизвестен
- ISBN:нет данных
- Рейтинг книги:4 / 5. Голосов: 1
-
Избранное:Добавить в избранное
- Отзывы:
-
Ваша оценка:
Data Science For Dummies: краткое содержание, описание и аннотация
Предлагаем к чтению аннотацию, описание, краткое содержание или предисловие (зависит от того, что написал сам автор книги «Data Science For Dummies»). Если вы не нашли необходимую информацию о книге — напишите в комментариях, мы постараемся отыскать её.
Data Science For Dummies Data Science For Dummies How natural language processing works Strategies around data science How to make decisions using probabilities Ways to display your data using a visualization model How to incorporate various programming languages into your strategy Whether you’re a professional or a student,
will get you caught up on all the latest data trends. Find out how to ask the pressing questions you need your data to answer by picking up your copy today.
Data Science For Dummies — читать онлайн ознакомительный отрывок
Ниже представлен текст книги, разбитый по страницам. Система сохранения места последней прочитанной страницы, позволяет с удобством читать онлайн бесплатно книгу «Data Science For Dummies», без необходимости каждый раз заново искать на чём Вы остановились. Поставьте закладку, и сможете в любой момент перейти на страницу, на которой закончили чтение.
Интервал:
Закладка:
Ordinary least squares (OLS) regression methods
Ordinary least squares (OLS) is a statistical method that fits a linear regression line to a dataset. With OLS, you do this by squaring the vertical distance values that describe the distances between the data points and the best-fit line, adding up those squared distances, and then adjusting the placement of the best-fit line so that the summed squared distance value is minimized. Use OLS if you want to construct a function that’s a close approximation to your data.
 As always, don’t expect the actual value to be identical to the value predicted by the regression. Values predicted by the regression are simply estimates that are most similar to the actual values in the model.
OLS is particularly useful for fitting a regression line to models containing more than one independent variable. In this way, you can use OLS to estimate the target from dataset features.
 When using OLS regression methods to fit a regression line that has more than one independent variable, two or more of the variables may be interrelated. When two or more independent variables are strongly correlated with each other, this is called multicollinearity . Multicollinearity tends to adversely affect the reliability of the variables as predictors when they’re examined apart from one another. Luckily, however, multicollinearity doesn’t decrease the overall predictive reliability of the model when it’s considered collectively.
Detecting Outliers
Many statistical and machine learning approaches assume that your data has no outliers. Outlier removal is an important part of preparing your data for analysis. In this section, you see a variety of methods you can use to discover outliers in your data.
Analyzing extreme values
Outliers are data points with values that are significantly different from the majority of data points comprising a variable. It’s important to find and remove outliers because, left untreated, they skew variable distribution, make variance appear falsely high, and cause a misrepresentation of intervariable correlations.
You can use outlier detection to spot anomalies that represent fraud, equipment failure, or cybersecurity attacks. In other words, outlier detection is a data preparation method and an analytical method in its own right.
Outliers fall into the following three categories:
Point: Point outliers are data points with anomalous values compared to the normal range of values in a feature.
Contextual: Contextual outliers are data points that are anomalous only within a specific context. To illustrate, if you’re inspecting weather station data from January in Orlando, Florida, and you see a temperature reading of 23 degrees F, this would be quite anomalous because the average temperature there is 70 degrees F in January. But consider if you were looking at data from January at a weather station in Anchorage, Alaska — a temperature reading of 23 degrees F in this context isn’t anomalous at all.
Collective: These outliers appear nearby one another, all having similar values that are anomalous to the majority of values in the feature.
You can detect outliers using either a univariate or multivariate approach, as spelled out in the next two sections.
Detecting outliers with univariate analysis
Univariate outlier detection is where you look at features in your dataset and inspect them individually for anomalous values. You can choose from two simple methods for doing this:
Tukey outlier labeling
Tukey boxplotting
Tukey boxplotting is an exploratory data analysis technique that’s useful for visualizing the distribution of data within a numeric variable by visualizing that distribution with quartiles. As you might guess, the Tukey boxplot was named after its inventor, John Tukey, an American mathematician who did most of his work back in the 1960s and 70s. Tukey outlier labeling refers to labeling data points (that lie beyond the minimum and maximum extremes of a box plot) as outliers.
It is cumbersome to use the Tukey method to manually calculate, identify, and label outliers, but if you want to do it, the trick is to look at how far the minimum and maximum values are from the 25 and 75 percentiles. The distance between the 1st quartile (at 25 percent) and the 3rd quartile (at 75 percent) is called the inter-quartile range (IQR), and it describes the data’s spread. When you look at a variable, consider its spread, its Q1 / Q3 values, and its minimum and maximum values to decide whether the variable is suspect for outliers.
 Here’s a good rule of thumb:
a = Q1 – 1.5*IQR
and
b = Q3 + 1.5*IQR.
If your minimum value is less than a, or your maximum value is greater than b, the variable probably has outliers.
On the other hand, it is quite easy to generate a Tukey boxplot and spot outliers using Python or R. Each boxplot has whiskers that are set at 1.5*IQR. Any values that lie beyond these whiskers are outliers. Figure 4-7 shows outliers as they appear within a Tukey boxplot that was generated in Python.
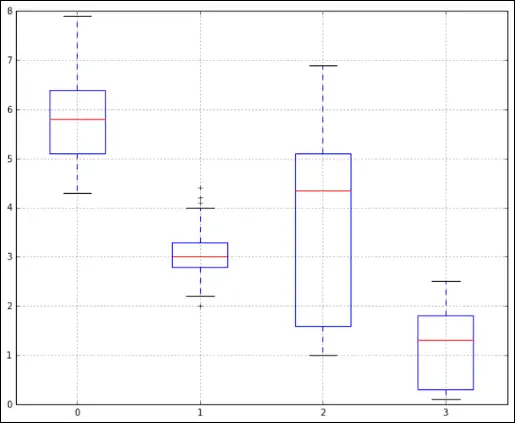
Credit: Python for Data Science Essential Training Part 1, LinkedIn.com
FIGURE 4-7:Spotting outliers with a Tukey boxplot.
Detecting outliers with multivariate analysis
Sometimes outliers show up only within combinations of data points from disparate variables. These outliers wreak havoc on machine learning algorithms, so it’s important to detect and remove them. You can use multivariate analysis of outliers to do this. A multivariate approach to outlier detection involves considering two or more variables at a time and inspecting them together for outliers. You can use one of several methods, including:
A scatter-plot matrix
Boxplotting
Density-based spatial clustering of applications with noise (DBScan) — as discussed in Chapter 5
Principal component analysis (PCA, as shown in Figure 4-8)
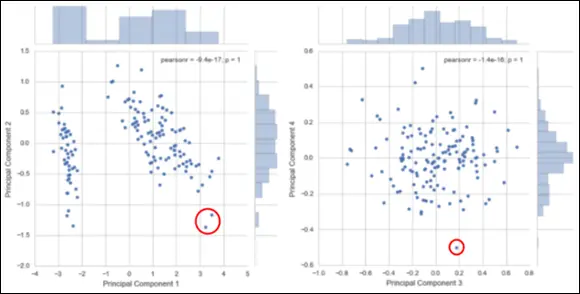
Credit: Python for Data Science Essential Training Part 2, LinkedIn.com
FIGURE 4-8:Using PCA to spot outliers.
Introducing Time Series Analysis
A time series is just a collection of data on attribute values over time. Time series analysis is performed to predict future instances of the measure based on the past observational data. To forecast or predict future values from data in your dataset, use time series techniques.
Identifying patterns in time series
Time series exhibit specific patterns. Take a look at Figure 4-9 to gain a better understanding of what these patterns are all about. Constant time series remain at roughly the same level over time but are subject to some random error. In contrast, trended series show a stable linear movement up or down. Whether constant or trended, time series may also sometimes exhibit seasonality — predictable, cyclical fluctuations that reoccur seasonally throughout a year. As an example of seasonal time series, consider how many businesses show increased sales during the holiday season.
Читать дальшеИнтервал:
Закладка:
Похожие книги на «Data Science For Dummies»
Представляем Вашему вниманию похожие книги на «Data Science For Dummies» списком для выбора. Мы отобрали схожую по названию и смыслу литературу в надежде предоставить читателям больше вариантов отыскать новые, интересные, ещё непрочитанные произведения.
![Роман Зыков - Роман с Data Science. Как монетизировать большие данные [litres]](/books/438007/roman-zykov-roman-s-data-science-kak-monetizirova-thumb.webp)


Обсуждение, отзывы о книге «Data Science For Dummies» и просто собственные мнения читателей. Оставьте ваши комментарии, напишите, что Вы думаете о произведении, его смысле или главных героях. Укажите что конкретно понравилось, а что нет, и почему Вы так считаете.