Lillian Pierson - Data Science For Dummies
Здесь есть возможность читать онлайн «Lillian Pierson - Data Science For Dummies» — ознакомительный отрывок электронной книги совершенно бесплатно, а после прочтения отрывка купить полную версию. В некоторых случаях можно слушать аудио, скачать через торрент в формате fb2 и присутствует краткое содержание. Жанр: unrecognised, на английском языке. Описание произведения, (предисловие) а так же отзывы посетителей доступны на портале библиотеки ЛибКат.
- Название:Data Science For Dummies
- Автор:
- Жанр:
- Год:неизвестен
- ISBN:нет данных
- Рейтинг книги:4 / 5. Голосов: 1
-
Избранное:Добавить в избранное
- Отзывы:
-
Ваша оценка:
Data Science For Dummies: краткое содержание, описание и аннотация
Предлагаем к чтению аннотацию, описание, краткое содержание или предисловие (зависит от того, что написал сам автор книги «Data Science For Dummies»). Если вы не нашли необходимую информацию о книге — напишите в комментариях, мы постараемся отыскать её.
Data Science For Dummies Data Science For Dummies How natural language processing works Strategies around data science How to make decisions using probabilities Ways to display your data using a visualization model How to incorporate various programming languages into your strategy Whether you’re a professional or a student,
will get you caught up on all the latest data trends. Find out how to ask the pressing questions you need your data to answer by picking up your copy today.
Data Science For Dummies — читать онлайн ознакомительный отрывок
Ниже представлен текст книги, разбитый по страницам. Система сохранения места последней прочитанной страницы, позволяет с удобством читать онлайн бесплатно книгу «Data Science For Dummies», без необходимости каждый раз заново искать на чём Вы остановились. Поставьте закладку, и сможете в любой момент перейти на страницу, на которой закончили чтение.
Интервал:
Закладка:
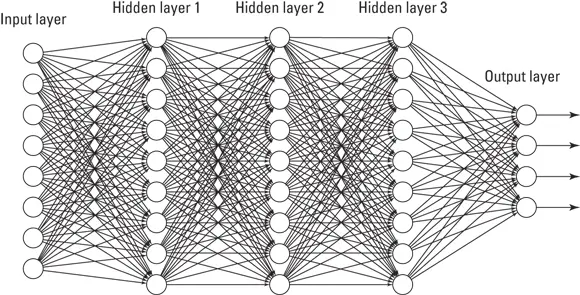
FIGURE 3-5:A deep learning network is a neural network with more than one hidden layer.
Deep learning is a machine learning method that uses hierarchical neural networks to learn from data in an iterative and adaptive manner. It’s an ideal approach for learning patterns from unlabeled and unstructured data. It’s essentially the same concept as the neural network, except that deep learning algorithms have two or more hidden layers. In fact, computer vision applications — like those that support facial recognition for images uploaded to Facebook, or the self-driving cars produced by Tesla — have been known to implement more than 150 hidden layers in a single deep neural network. The more hidden layers there are, the more complex a decision the algorithm can make.
Using Spark to generate real-time big data analytics
Apache Spark is an in-memory distributed computing application that you can use to deploy machine learning algorithms on big data sources in near-real-time to generate analytics from streaming big data sources. Whew!
 In-memory refers to processing data within the computer’s memory, without actually reading and writing its computational results onto the disk. In-memory computing provides its results a lot faster but cannot process much data per processing interval.
Because it processes data in microbatches, with 3-second cycle times, you can use it to significantly decrease time-to-insight in cases where time is of the essence. It can be run on data that sits in a wide variety of storage architectures, including Hadoop HDFS, Amazon Redshift, MongoDB, Cassandra, Solr and AWS. Spark is composed of the following submodules:
Spark SQL: You use this module to work with and query structured data using Spark. Within Spark, you can query data using Spark’s built-in SQL package: SparkSQL. You can also query structured data using Hive, but then you’d use the HiveQL language and run the queries using the Spark processing engine.
GraphX: The GraphX library is how you store and process network data from within Spark.
Streaming: The Streaming module is where the big data processing takes place. This module basically breaks a continuously streaming data source into much smaller data streams, called Dstreams — discreet data streams, in other words. Because the Dstreams are small, these batch cycles can be completed within three seconds, which is why it’s called microbatch processing.
MLlib: The MLlib submodule is where you analyze data, generate statistics, and deploy machine learning algorithms from within the Spark environment. MLlib has APIs for Java, Scala, Python, and R. The MLlib module allows data professionals to work within Spark to build machine learning models in Python or R, and those models will then pull data directly from the requisite data storage repository, whether that be on-premise, in a cloud, or even a multicloud environment. This helps reduce the reliance that data scientists sometimes have on data engineers. Furthermore, computations are known to be 100 times faster when processed in-memory using Spark as opposed to the traditional MapReduce framework.
You can deploy Spark on-premise by downloading the open-source framework from the Apache Spark website, at http://spark.apache.org/downloads.html . Another option is to run Spark on the cloud via the Apache Databricks service, at https://databricks.com .
Chapter 4
Math, Probability, and Statistical Modeling
IN THIS CHAPTER
 Introducing the core basics of statistical probability
Quantifying correlation
Reducing dataset dimensionality
Building decision models with multiple criteria decision-making
Diving into regression methods
Detecting outliers
Talking about time series analysis
Math and statistics are not the scary monsters that many people make them out to be. In data science, the need for these quantitative methods is simply a fact of life — and nothing to get alarmed over. Although you must have a handle on the math and statistics that are necessary to solve a problem, you don’t need to go study for degrees in those fields.
Contrary to what many pure statisticians would have you believe, the data science field isn’t the same as the statistics field. Data scientists have substantive knowledge in one field or several fields, and they use statistics, math, coding, and strong communication skills to help them discover, understand, and communicate data insights that lie within raw datasets related to their field of expertise. Statistics is a vital component of this formula, but not more vital than the others. In this chapter, I introduce you to the basic ideas behind probability, correlation analysis, dimensionality reduction, decision modeling, regression analysis, outlier detection, and time series analysis.
Exploring Probability and Inferential Statistics
Probability is one of the most fundamental concepts in statistics. To even get started making sense of your data by using statistics, you need to be able to identify something as basic as whether you’re looking at descriptive or inferential statistics. You also need a firm grasp of the basics of probability distribution. The following sections cover these concepts and more.
A statistic is a result that’s derived from performing a mathematical operation on numerical data. In general, you use statistics in decision-making. Statistics come in two flavors:
Descriptive: Descriptive statistics provide a description that illuminates some characteristic of a numerical dataset, including dataset distribution, central tendency (such as mean, min, or max), and dispersion (as in standard deviation and variance). For clarification, the mean of a data set is the average value of its data points, its min is the minimum value of its data points and the max is the maximum value. Descriptive statistics are not meant to illustrate any causal claims. Descriptive statistics can highlight relationships between X and Y, but they do not posit that X causes Y.
Inferential: Rather than focus on pertinent descriptions of a dataset, inferential statistics carve out a smaller section of the dataset and attempt to deduce significant information about the larger dataset. Unlike descriptive statistics, inferential methods, such as regression analysis, DO try to predict by studying causation. Use this type of statistics to derive information about a real-world measure in which you’re interested.
Читать дальшеИнтервал:
Закладка:
Похожие книги на «Data Science For Dummies»
Представляем Вашему вниманию похожие книги на «Data Science For Dummies» списком для выбора. Мы отобрали схожую по названию и смыслу литературу в надежде предоставить читателям больше вариантов отыскать новые, интересные, ещё непрочитанные произведения.
![Роман Зыков - Роман с Data Science. Как монетизировать большие данные [litres]](/books/438007/roman-zykov-roman-s-data-science-kak-monetizirova-thumb.webp)


Обсуждение, отзывы о книге «Data Science For Dummies» и просто собственные мнения читателей. Оставьте ваши комментарии, напишите, что Вы думаете о произведении, его смысле или главных героях. Укажите что конкретно понравилось, а что нет, и почему Вы так считаете.