Lillian Pierson - Data Science For Dummies
Здесь есть возможность читать онлайн «Lillian Pierson - Data Science For Dummies» — ознакомительный отрывок электронной книги совершенно бесплатно, а после прочтения отрывка купить полную версию. В некоторых случаях можно слушать аудио, скачать через торрент в формате fb2 и присутствует краткое содержание. Жанр: unrecognised, на английском языке. Описание произведения, (предисловие) а так же отзывы посетителей доступны на портале библиотеки ЛибКат.
- Название:Data Science For Dummies
- Автор:
- Жанр:
- Год:неизвестен
- ISBN:нет данных
- Рейтинг книги:4 / 5. Голосов: 1
-
Избранное:Добавить в избранное
- Отзывы:
-
Ваша оценка:
Data Science For Dummies: краткое содержание, описание и аннотация
Предлагаем к чтению аннотацию, описание, краткое содержание или предисловие (зависит от того, что написал сам автор книги «Data Science For Dummies»). Если вы не нашли необходимую информацию о книге — напишите в комментариях, мы постараемся отыскать её.
Data Science For Dummies Data Science For Dummies How natural language processing works Strategies around data science How to make decisions using probabilities Ways to display your data using a visualization model How to incorporate various programming languages into your strategy Whether you’re a professional or a student,
will get you caught up on all the latest data trends. Find out how to ask the pressing questions you need your data to answer by picking up your copy today.
Data Science For Dummies — читать онлайн ознакомительный отрывок
Ниже представлен текст книги, разбитый по страницам. Система сохранения места последней прочитанной страницы, позволяет с удобством читать онлайн бесплатно книгу «Data Science For Dummies», без необходимости каждый раз заново искать на чём Вы остановились. Поставьте закладку, и сможете в любой момент перейти на страницу, на которой закончили чтение.
Интервал:
Закладка:
d = difference between the two ranks of each data point
n = total number of data points in the data set
FIGURE 4-2:An example of a non-linear relationship between watch time and % viewership.
Reducing Data Dimensionality with Linear Algebra
Any intermediate-level data scientist should have a good understanding of linear algebra and how to do math using matrices. Array and matrix objects are the primary data structure in analytical computing. You need them in order to perform mathematical and statistical operations on large and multidimensional datasets — datasets with many different features to be tracked simultaneously. In this section, you see exactly what is involved in using linear algebra and machine learning methods to reduce a dataset’s dimensionality — in other words, to reduce a dataset’s feature count, without losing the important information the dataset contains, by compressing its features’ information into synthetic variables that you can subsequently utilize to make predictions or as input into another machine learning model.
Decomposing data to reduce dimensionality
Okay, what can you do with all this theory? Well, for starters, using a linear algebra method called singular value decomposition (SVD), you can reduce the dimensionality of your dataset — reduce the number of features that you track when carrying out an analysis, in other words. Dimension reduction algorithms are ideal options if you need to compress your dataset while also removing redundant information and noise. In data science, SVD is applied to analyze principal components from with large, noisy, sparse data sets — an approach machine learning folks call Principal Component Analysis (PCA) . Since the linear algebra involved in PCA is rooted in SVD, let’s look at how SVD works.
 The difference between SVD and PCA is just this: PCA assumes that you are working with a square (1x1) input matrix. If your input matrix is not square, then use SVD instead, because SVD does not make this assumption. PCA is covered in greater detail later in this chapter.
The SVD linear algebra method decomposes the data matrix into the three resultant matrices shown in Figure 4-4. The product of these matrices, when multiplied together, gives you back your original matrix. SVD is handy when you want to compress or clean your dataset. Using SVD enables you to uncover latent variables — inferred variables hidden within your dataset that affect how that dataset behaves. Two main ways to use the SVD algorithm include
Compressing sparse matrices: If you have a clean yet sparse dataset then, you don’t want to remove any of the information that the dataset holds, but you do need to compress that information down into a manageable number of variables, so that you can use them to make predictions. A handy thing about SVD is that it allows you to set the number of variables, or components, it creates from your original dataset. And if you don’t remove any of those components, then you will reduce the size of your dataset without losing any of its important information. This process is illustrated in Figure 4-3.
Cleaning and compressing dirty data: In other cases, you can use SVD to do an algorithmic cleanse of a dirty, noisy dataset. In this case you’d apply SVD to uncover your components, and then decide which of them to keep by looking at their variance. The industry standard is that explained variance of the components you keep should add up to at least 75 percent or more. This ensures that at least 75 percent of the dataset’s original information has been retained within the components you’ve kept. This process is illustrated in Figure 4-4.
 If the sum of the explained variance — or cumulative variance explained (CVE) — for the components you keep is less than 95 percent, do not use the components as derived features further downstream in other machine learning models. In this case, the information lost within these derived features will cause the machine learning model to generate inaccurate, unreliable predictions. These derived components are, however, useful as a source for descriptive statistics or for building more general descriptive analytics — in other words, analytics that describe what happened in the past, and answer questions like “what happened” “when” “how many”, and “where.”
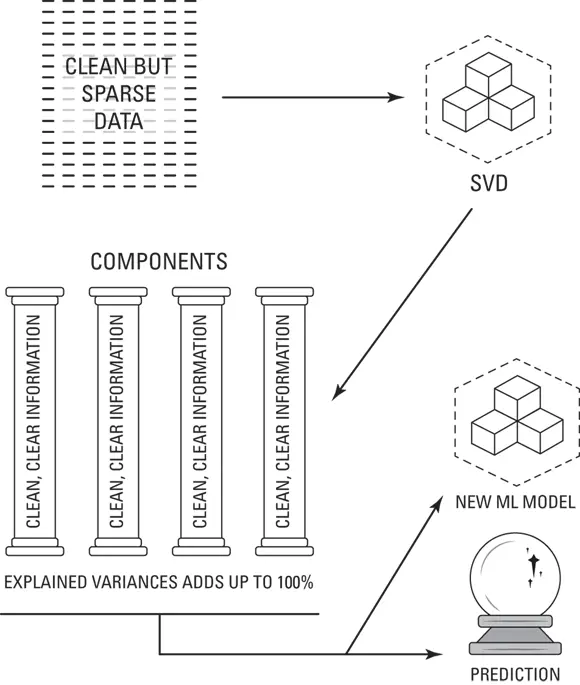
FIGURE 4-3:Applying SVD to compress a sparse, clean dataset.
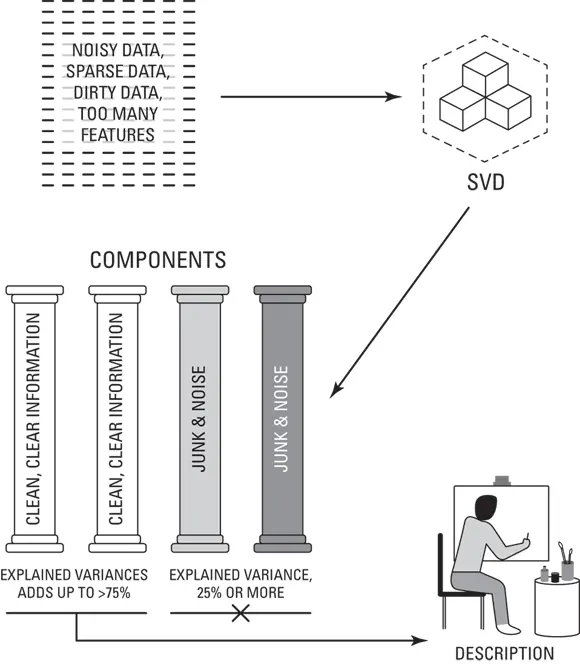
FIGURE 4-4:Applying SVD to clean and compress a sparse, dirty dataset.
 The lower the CVE, the more you should take your model’s results with a grain of salt.
If you remove some components, then when you go to reconstruct your matrix, you'll probably notice that the resulting matrix isn’t an exact match to your original dataset. Worry not! That is the data that remains after much of the information redundancy and noise was filtered out by SVD and removed by you.
Getting a little nitty-gritty about SVD, let’s look at the formula for SVD, but keep in mind — this is linear algebra not regular algebra, so we are looking at matrix math not regular math. To take it from the beginning, you need to understand the concept of eigenvector. To do that, think of a matrix called A. Now consider a nonzero vector called x and that Ax = λx for a scalar λ. In this scenario, scalar λ is what’s called an eigenvalue of matrix A. It’s permitted to take on a value of 0. Furthermore, x is the eigenvector that corresponds to λ, and again, it’s not permitted to be a zero value. λ is simply the scale factor of the eigenvector. SVD decomposes the matrix down into three resultant matrices shown in Figure 4-5. The product of these matrices, when multiplied together, gives you back your original matrix.
Take a closer look at Figure 4-5:
A = u * S * v
A: This is the matrix that holds all your original data.
u: This is a left-singular vector (an eigenvector) of A, and it holds all the important, nonredundant information about your data’s observations.
v: This is a right-singular eigenvector of A. It holds all the important, nonredundant information about columns in your dataset’s features.
S: This is the square root of the eigenvalue of A. It contains all the information about the procedures performed during the compression.
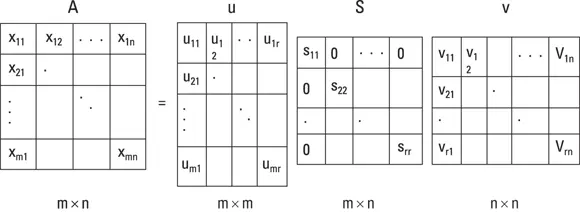
FIGURE 4-5:You can use SVD to decompose data down to u, S, and V matrices.
Читать дальшеИнтервал:
Закладка:
Похожие книги на «Data Science For Dummies»
Представляем Вашему вниманию похожие книги на «Data Science For Dummies» списком для выбора. Мы отобрали схожую по названию и смыслу литературу в надежде предоставить читателям больше вариантов отыскать новые, интересные, ещё непрочитанные произведения.
![Роман Зыков - Роман с Data Science. Как монетизировать большие данные [litres]](/books/438007/roman-zykov-roman-s-data-science-kak-monetizirova-thumb.webp)


Обсуждение, отзывы о книге «Data Science For Dummies» и просто собственные мнения читателей. Оставьте ваши комментарии, напишите, что Вы думаете о произведении, его смысле или главных героях. Укажите что конкретно понравилось, а что нет, и почему Вы так считаете.