Lillian Pierson - Data Science For Dummies
Здесь есть возможность читать онлайн «Lillian Pierson - Data Science For Dummies» — ознакомительный отрывок электронной книги совершенно бесплатно, а после прочтения отрывка купить полную версию. В некоторых случаях можно слушать аудио, скачать через торрент в формате fb2 и присутствует краткое содержание. Жанр: unrecognised, на английском языке. Описание произведения, (предисловие) а так же отзывы посетителей доступны на портале библиотеки ЛибКат.
- Название:Data Science For Dummies
- Автор:
- Жанр:
- Год:неизвестен
- ISBN:нет данных
- Рейтинг книги:4 / 5. Голосов: 1
-
Избранное:Добавить в избранное
- Отзывы:
-
Ваша оценка:
Data Science For Dummies: краткое содержание, описание и аннотация
Предлагаем к чтению аннотацию, описание, краткое содержание или предисловие (зависит от того, что написал сам автор книги «Data Science For Dummies»). Если вы не нашли необходимую информацию о книге — напишите в комментариях, мы постараемся отыскать её.
Data Science For Dummies Data Science For Dummies How natural language processing works Strategies around data science How to make decisions using probabilities Ways to display your data using a visualization model How to incorporate various programming languages into your strategy Whether you’re a professional or a student,
will get you caught up on all the latest data trends. Find out how to ask the pressing questions you need your data to answer by picking up your copy today.
Data Science For Dummies — читать онлайн ознакомительный отрывок
Ниже представлен текст книги, разбитый по страницам. Система сохранения места последней прочитанной страницы, позволяет с удобством читать онлайн бесплатно книгу «Data Science For Dummies», без необходимости каждый раз заново искать на чём Вы остановились. Поставьте закладку, и сможете в любой момент перейти на страницу, на которой закончили чтение.
Интервал:
Закладка:
Earnings growth potential: Using a binary variable to score the earnings growth potential, then you could say that an investment that falls under a specific earnings growth potential threshold gets scored as 0 (as in “no — the potential is not enough”); anything higher than that threshold gets a 1 (for “yes — the potential is adequate”).
Earnings quality rating: Using a binary variable to score earnings quality ratings, then you could say that an investment falling within a particular ratings class for earnings quality gets scored as 1 (for “yes — the rating is adequate”); otherwise, it gets scored as a 0 (as in “no — it’s earning quality rating is not good enough”).For you non-Wall Street types out there, earnings quality refers to various measures used to determine how kosher a company’s reported earnings are; such measures attempt to answer the question, “Do these reported figures pass the smell test?”
Dividend performance: Using a binary variable to score dividend performance, then you could say that when an investment fails to reach a set dividend performance threshold, it gets a 0 (as in “no — it’s dividend performance is not good enough”); if it reaches or surpasses that threshold, it gets a 1 (for “yes — the performance is adequate”).
Imagine that you’re evaluating 20 different potential investments. In this evaluation, you’d score each criterion for each of the investments. To eliminate poor investment choices, simply sum the criteria scores for each of the alternatives and then dismiss any investments that don’t earn a total score of 3 — leaving you with the investments that fall within a certain threshold of earning growth potential, that have good earnings quality, and whose dividends perform at a level that’s acceptable to you.
 For some hands-on practice doing multiple criteria decision-making, go to the companion website to this book (
 www.businessgrowth.ai ) and check out the MCDM practice problem I’ve left for you there.
Focusing on fuzzy MCDM
If you prefer to evaluate suitability within a range, rather than use binary membership terms of 0 or 1, you can use fuzzy multiple criteria decision-making (FMCDM) to do that. With FMCDM you can evaluate all the same types of problems as you would with MCDM. The term fuzzy refers to the fact that the criteria being used to evaluate alternatives offer a range of acceptability — instead of the binary, crisp set criteria associated with traditional MCDM. Evaluations based on fuzzy criteria lead to a range of potential outcomes, each with its own level of suitability as a solution.
One important feature of FMCDM: You’re likely to have a list of several fuzzy criteria, but these criteria might not all hold the same importance in your evaluation. To correct for this, simply assign weights to criteria to quantify their relative importance.
Introducing Regression Methods
Machine learning algorithms of the regression variety were adopted from the statistics field in order to provide data scientists with a set of methods for describing and quantifying the relationships between variables in a dataset. Use regression techniques if you want to determine the strength of correlation between variables in your data. As for using regression to predict future values from historical values, feel free to do it, but be careful: Regression methods assume a cause-and-effect relationship between variables, but present circumstances are always subject to flux. Predicting future values from historical ones will generate incorrect results when present circumstances change. In this section, I tell you all about linear regression, logistic regression, and the ordinary least squares method.
Linear regression
Linear regression is a machine learning method you can use to describe and quantify the relationship between your target variable, y — the predictant, in statistics lingo — and the dataset features you’ve chosen to use as predictor variables (commonly designated as dataset X in machine learning). When you use just one variable as your predictor, linear regression is as simple as the middle school algebra formula y=mx+b. A classic example of linear regression is its usage in predicting home prices, as shown in Figure 4-6. You can also use linear regression to quantify correlations between several variables in a dataset — called multiple linear regression . Before getting too excited about using linear regression, though, make sure you’ve considered its limitations:
Linear regression works with only numerical variables, not categorical ones.
If your dataset has missing values, it will cause problems. Be sure to address your missing values before attempting to build a linear regression model.
If your data has outliers present, your model will produce inaccurate results. Check for outliers before proceeding.
The linear regression model assumes that a linear relationship exists between dataset features and the target variable.
The linear regression model assumes that all features are independent of each other.
Prediction errors, or residuals, should be normally distributed.
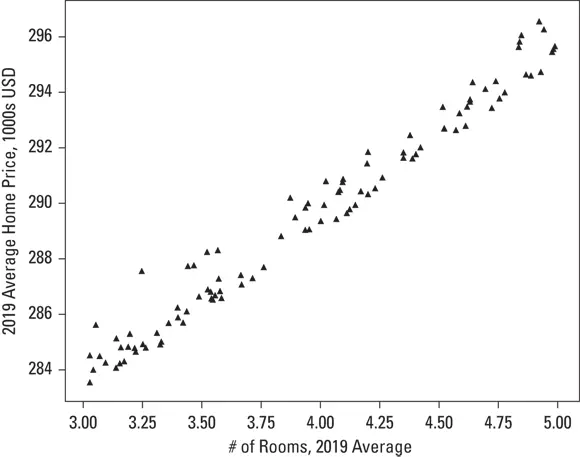
Credit: Python for Data Science Essential Training Part 2, LinkedIn.com
FIGURE 4-6:Linear regression used to predict home prices based on the number of rooms in a house.
 Don’t forget dataset size! A good rule of thumb is that you should have at least 20 observations per predictive feature if you expect to generate reliable results using linear regression.
Logistic regression
Logistic regression is a machine learning method you can use to estimate values for a categorical target variable based on your selected features. Your target variable should be numeric and should contain values that describe the target’s class — or category. One cool aspect of logistic regression is that, in addition to predicting the class of observations in your target variable, it indicates the probability for each of its estimates. Though logistic regression is like linear regression, its requirements are simpler, in that:
There doesn't need to be a linear relationship between the features and target variable.
Residuals don’t have to be normally distributed.
Predictive features aren’t required to have a normal distribution.
When deciding whether logistic regression is a good choice for you, consider the following limitations:
Missing values should be treated or removed.
Your target variable must be binary or ordinal. Binary classification assigns a 1 for “yes” and a 0 for “no.”
Predictive features should be independent of each other.
Logistic regression requires a greater number of observations than linear regression to produce a reliable result. The rule of thumb is that you should have at least 50 observations per predictive feature if you expect to generate reliable results.
Predicting survivors on the Titanic is the classic practice problem for newcomers to learn logistic regression. You can practice it and see lots of examples of this problem worked out over on Kaggle. ( www.kaggle.com/c/titanic ).
Интервал:
Закладка:
Похожие книги на «Data Science For Dummies»
Представляем Вашему вниманию похожие книги на «Data Science For Dummies» списком для выбора. Мы отобрали схожую по названию и смыслу литературу в надежде предоставить читателям больше вариантов отыскать новые, интересные, ещё непрочитанные произведения.
![Роман Зыков - Роман с Data Science. Как монетизировать большие данные [litres]](/books/438007/roman-zykov-roman-s-data-science-kak-monetizirova-thumb.webp)


Обсуждение, отзывы о книге «Data Science For Dummies» и просто собственные мнения читателей. Оставьте ваши комментарии, напишите, что Вы думаете о произведении, его смысле или главных героях. Укажите что конкретно понравилось, а что нет, и почему Вы так считаете.