Lillian Pierson - Data Science For Dummies
Здесь есть возможность читать онлайн «Lillian Pierson - Data Science For Dummies» — ознакомительный отрывок электронной книги совершенно бесплатно, а после прочтения отрывка купить полную версию. В некоторых случаях можно слушать аудио, скачать через торрент в формате fb2 и присутствует краткое содержание. Жанр: unrecognised, на английском языке. Описание произведения, (предисловие) а так же отзывы посетителей доступны на портале библиотеки ЛибКат.
- Название:Data Science For Dummies
- Автор:
- Жанр:
- Год:неизвестен
- ISBN:нет данных
- Рейтинг книги:4 / 5. Голосов: 1
-
Избранное:Добавить в избранное
- Отзывы:
-
Ваша оценка:
Data Science For Dummies: краткое содержание, описание и аннотация
Предлагаем к чтению аннотацию, описание, краткое содержание или предисловие (зависит от того, что написал сам автор книги «Data Science For Dummies»). Если вы не нашли необходимую информацию о книге — напишите в комментариях, мы постараемся отыскать её.
Data Science For Dummies Data Science For Dummies How natural language processing works Strategies around data science How to make decisions using probabilities Ways to display your data using a visualization model How to incorporate various programming languages into your strategy Whether you’re a professional or a student,
will get you caught up on all the latest data trends. Find out how to ask the pressing questions you need your data to answer by picking up your copy today.
Data Science For Dummies — читать онлайн ознакомительный отрывок
Ниже представлен текст книги, разбитый по страницам. Система сохранения места последней прочитанной страницы, позволяет с удобством читать онлайн бесплатно книгу «Data Science For Dummies», без необходимости каждый раз заново искать на чём Вы остановились. Поставьте закладку, и сможете в любой момент перейти на страницу, на которой закончили чтение.
Интервал:
Закладка:
Categorical distributions (non-numeric): These represent either non-numeric categorical variables or ordinal variables (an ordered categorical variable, for example the level of service offered by most airlines is ordinal because they offer first class, business class, and economy class seats).
Conditional probability with Naïve Bayes
You can use the Naïve Bayes machine learning method, which was borrowed straight from the statistics field, to predict the likelihood that an event will occur, given evidence defined in your data features — something called conditional probability . Naïve Bayes, which is based on classification and regression, is especially useful if you need to classify text data.
To better illustrate this concept, consider the Spambase dataset that’s available from University of California, Irvine’s machine learning repository ( https://archive.ics.uci.edu/ml/datasets/Spambase ). That dataset contains 4,601 records of emails and, in its last field, designates whether each email is spam. From this dataset, you can identify common characteristics between spam emails. After you’ve defined common features that indicate spam email, you can build a Naïve Bayes classifier that reliably predicts whether an incoming email is spam, based on the empirical evidence supported in its content. In other words, the model predicts whether an email is spam — the event — based on features gathered from its content — the evidence .
 When it comes to experimentation, multinomial and binomial distributions behave similarly, except those multinomial distributions can produce two or more outcomes, and binomial distributions can only produce two outcomes.
Naïve Bayes comes in these three popular flavors:
MultinomialNB: Use this version if your variables (categorical or continuous) describe discrete frequency counts, like word counts. This version of Naïve Bayes assumes a multinomial distribution, as is often the case with text data. It does not accept negative values.
BernoulliNB: If your features are binary, you can use multinomial Bernoulli Naïve Bayes to make predictions. This version works for classifying text data but isn’t generally known to perform as well as MultinomialNB. If you want to use BernoulliNB to make predictions from continuous variables, that will work, but you first need to subdivide the variables into discrete interval groupings (also known as binning ).
GaussianNB: Use this version if all predictive features are normally distributed. It’s not a good option for classifying text data, but it can be a good choice if your data contains both positive and negative values (and if your features have a normal distribution, of course).
 Before building a Bayes classifier naïvely, consider that the model holds an a priori assumption — meaning that its predictions are based on an assumption that past conditions still hold true. Predicting future values from historical ones generates incorrect results when present circumstances change.
Quantifying Correlation
Many statistical and machine learning methods assume that your features are independent. To test whether they’re independent, though, you need to evaluate their correlation — the extent to which variables demonstrate interdependency. In this section, you get a brief introduction to Pearson correlation and Spearman’s rank correlation.
 Correlation is quantified per the value of a variable called r, which ranges between –1 and 1. The closer the r-value is to 1 or –1, the more correlation there is between two variables. If two variables have an r-value that’s close to 0, it could indicate that they’re independent variables.
Calculating correlation with Pearson’s r
If you want to uncover dependent relationships between continuous variables in a dataset, you’d use statistics to estimate their correlation. The simplest form of correlation analysis is the Pearson correlation, which assumes that
Your data is normally distributed.
You have continuous, numeric variables.
Your variables are linearly related. You can identify a linear relationship by plotting the data points on a chart and looking to see if there is a clear increasing or decreasing trend within the values of the data points, such that a straight line can be drawn to summarize that trend. See Figure 4-1 for an illustration of what a linear relationship looks like.
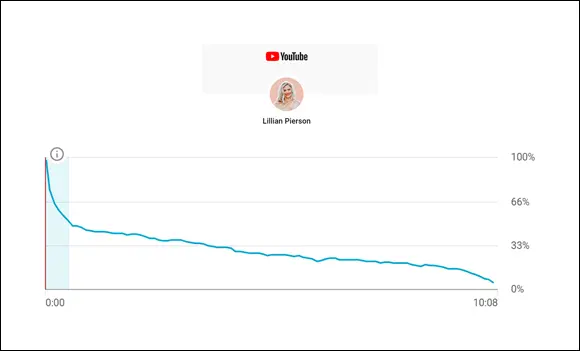
FIGURE 4-1:An example of a linear relationship between months and YouTube subscribers.
Because the Pearson correlation has so many conditions, use it only to determine whether a relationship between two variables exists, but not to rule out possible relationships. If you were to get an r-value that is close to 0, it indicates that there is no linear relationship between the variables but that a nonlinear relationship between them still could exist.
To use the Pearson’s r to test for linear correlation between two variables, you’d simply plug your data into the following formula and calculate the result.
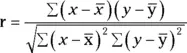
= mean of x variable
= mean of y variable
r = Pearson r coefficient of correlation
Once you get a value for your Pearson r, you’d interpret it value according to the following standards:
if r close to +1: Strong positive correlation between variables
if r = 0: Variables are not linearly correlated
if r close to -1: Strong negative correlation between variables
Ranking variable-pairs using Spearman’s rank correlation
The Spearman’s rank correlation is a popular test for determining correlation between ordinal variables. By applying Spearman’s rank correlation, you’re converting numeric variable-pairs into ranks by calculating the strength of the relationship between variables and then ranking them per their correlation.
The Spearman’s rank correlation assumes that
Your variables are ordinal.
Your variables are related nonlinearly. You can identify nonlinearity between variables by looking at a graph. If the graph between two variables produces a curve (for example, like the one shown in Figure 4-2) then the variables have a nonlinear relationship. This curvature occurs because, with variables related in a non-linear manner, a change in the value of x does not necessarily correspond to the same change in dataset’s y-value.
Your data is nonnormally distributed.
To use Spearman Rank to test for correlation between ordinal variables, you’d simply plug the values for your variables into the following formula and calculate the result.
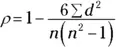
ρ = Spearman's rank correlation coefficient
Читать дальшеИнтервал:
Закладка:
Похожие книги на «Data Science For Dummies»
Представляем Вашему вниманию похожие книги на «Data Science For Dummies» списком для выбора. Мы отобрали схожую по названию и смыслу литературу в надежде предоставить читателям больше вариантов отыскать новые, интересные, ещё непрочитанные произведения.
![Роман Зыков - Роман с Data Science. Как монетизировать большие данные [litres]](/books/438007/roman-zykov-roman-s-data-science-kak-monetizirova-thumb.webp)


Обсуждение, отзывы о книге «Data Science For Dummies» и просто собственные мнения читателей. Оставьте ваши комментарии, напишите, что Вы думаете о произведении, его смысле или главных героях. Укажите что конкретно понравилось, а что нет, и почему Вы так считаете.