Ian Smith - Smith's Elements of Soil Mechanics
Здесь есть возможность читать онлайн «Ian Smith - Smith's Elements of Soil Mechanics» — ознакомительный отрывок электронной книги совершенно бесплатно, а после прочтения отрывка купить полную версию. В некоторых случаях можно слушать аудио, скачать через торрент в формате fb2 и присутствует краткое содержание. Жанр: unrecognised, на английском языке. Описание произведения, (предисловие) а так же отзывы посетителей доступны на портале библиотеки ЛибКат.

- Название:Smith's Elements of Soil Mechanics
- Автор:
- Жанр:
- Год:неизвестен
- ISBN:нет данных
- Рейтинг книги:5 / 5. Голосов: 1
-
Избранное:Добавить в избранное
- Отзывы:
-
Ваша оценка:
Smith's Elements of Soil Mechanics: краткое содержание, описание и аннотация
Предлагаем к чтению аннотацию, описание, краткое содержание или предисловие (зависит от того, что написал сам автор книги «Smith's Elements of Soil Mechanics»). Если вы не нашли необходимую информацию о книге — напишите в комментариях, мы постараемся отыскать её.
Smith's Elements of Soil Mechanics — читать онлайн ознакомительный отрывок
Ниже представлен текст книги, разбитый по страницам. Система сохранения места последней прочитанной страницы, позволяет с удобством читать онлайн бесплатно книгу «Smith's Elements of Soil Mechanics», без необходимости каждый раз заново искать на чём Вы остановились. Поставьте закладку, и сможете в любой момент перейти на страницу, на которой закончили чтение.
Интервал:
Закладка:
After completing part of a flow net, it is usually possible to tell whether or not the final diagram will be correct. The curvature of the flow lines and the direction of the equipotentials indicate if there is any distortion, which tends to be magnified as more of the flow net is drawn. This gives a good indication of what was wrong with the first flow line. This line must now be redrawn in its corrected position and the procedure repeated again, amending the first flow line if necessary, until a satisfactory net is obtained.
Generally, the number of flow channels, N fwill not be a whole number, and in these cases, an estimate is made as to where the next flow line would be if the impermeable layer was lower. The width of the lowest channel can then be found (e.g. in Fig. 2.10f, N f= 3.3).
Note: In flow net problems, we assume that the permeability of the soil is uniform throughout the soil's thickness. This is a considerable assumption and we see therefore that refinement in the construction of a flow net is unnecessary, since the difference between a roughly sketched net and an accurate one is small compared with the actual flow pattern in the soil and the theoretical pattern assumed. This is where numerical models have particular advantage over hand‐drawn flow nets.
Example 2.5 Flow net seepage
Using Fig. 2.9f, determine the loss through seepage under the dam in cubic metres per year if k = 3 × 10 −6m/s and the level of water above the base of the dam is 10 m upstream and 2 m downstream. The length of the dam perpendicular to the plane of seepage is 300 m.
Solution:
From the flow net N f= 3.3, N d= 9
Total head loss, h = 10 − 2 = 8 m


2.11 Critical flow conditions
2.11.1 Critical hydraulic gradient, i c
Figure 2.11shows a sample of soil encased in a vessel of cross‐sectional area A, with upward flow of water through the soil taking place under a constant head. The total head of water above the sample base = h + 1, and the head of water in the sample above the base = 1, therefore the excess hydrostatic pressure acting on the base of the sample = γ wh.
If any friction between the soil and the side of the container is ignored, then the soil is on the point of being washed out when the downward forces equal the upward forces:

Upward forces = h γ wAi.e.
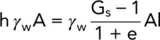
or when
(2.22) 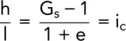
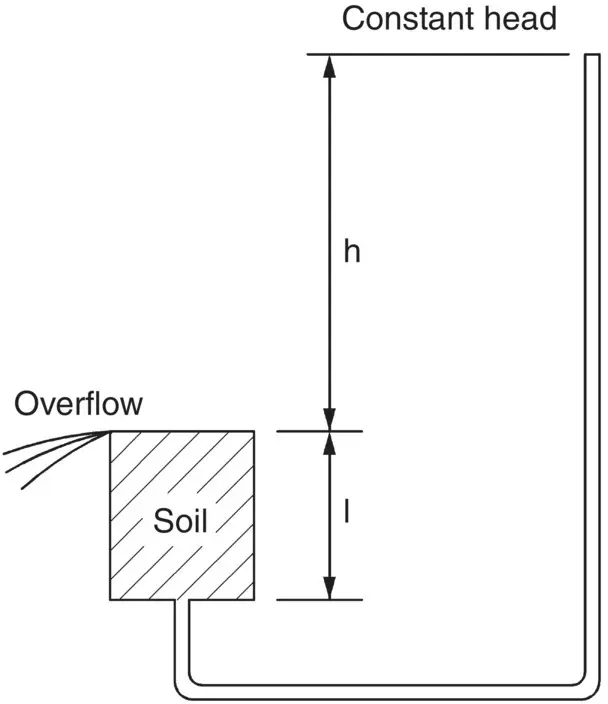
Fig. 2.11 Upward flow through a soil sample.
This particular value of hydraulic gradient is known as the critical hydraulic gradient and has an average value of about one for most soils. It makes a material a quicksand, which is not a type of soil but a flow condition within the soil. Generally, quicksand conditions occur in fine sands when the upward flow conditions achieve this state, but there is no theoretical reason why they should not occur in gravels (or any granular material) provided that the quantity of flow and the head are large enough. Other terms used to describe this condition are piping or boiling , but piping will not occur in fine silts and clays due to cohesive forces holding the particles together; instead there can be a heave of a large mass of soil if the upward forces are large enough.
2.11.2 Seepage force
Whenever water flows through a soil, a seepage force is exerted (as in quicksands). In Fig. 2.11, the excess head h is used up in forcing water through the soil voids over a length of l. This head dissipation is caused by friction and, because of the energy loss, a drag or force is exerted in the direction of flow.
The upward force h γ wA represents the seepage force, and in the case of uniform flow conditions, it can be assumed to spread uniformly throughout the volume of the soil:
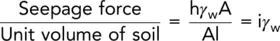
This means that in an isotropic soil, the seepage force acts in the direction of flow and has a magnitude = i γ wper unit volume.
2.11.3 Alleviation of piping
The risk of piping can occur in several circumstances, such as a cofferdam ( Fig. 2.12a) or the downstream end of a dam ( Fig. 2.12b).
To increase the factor of safety against piping in these cases, two methods can be adopted. The first procedure involves increasing the depth of pile penetration in Fig. 2.12a and inserting a sheet pile at the heel of the dam in Fig. 2.12b; in either case, there is an increase in the length of the flow path for the water with a resulting drop in the excess pressure at the critical section. A similar effect is achieved by laying down a blanket of impermeable material for some length along the upstream ground surface ( Fig. 2.12b).
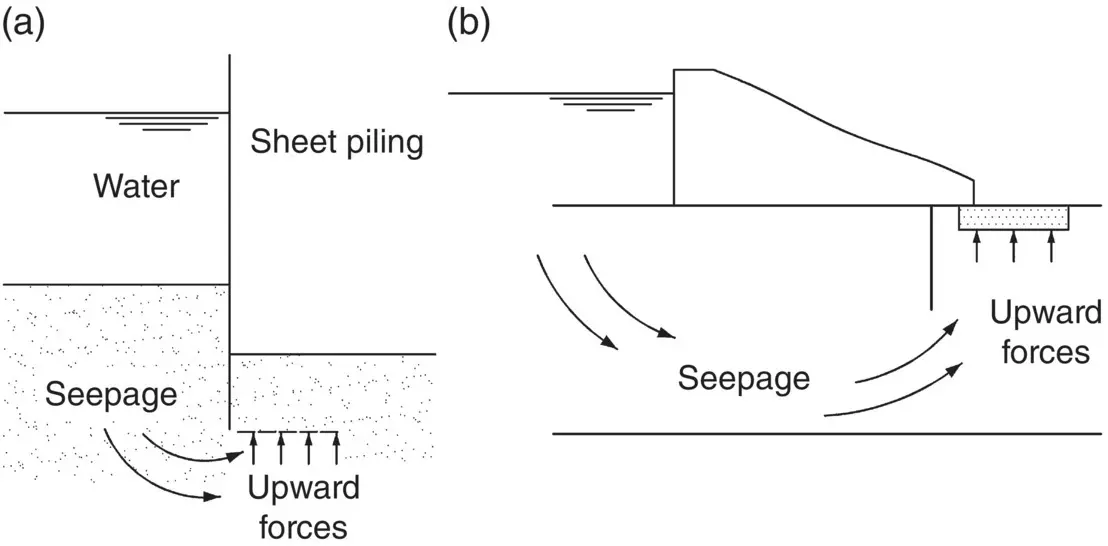
Fig. 2.12 Examples where piping can occur. (a) Cofferdam. (b) Downstream end of a dam.
The second procedure is to place a surcharge on the ground surface of the downstream side, the weight of which increases the downward forces, or to install a drainage system (e.g. perforated pipe protected by a filter) at the downstream side.
Example 2.6Buoyant uplift
An 8 m thick layer of silty clay is overlying a gravel stratum containing water under artesian pressure. A standpipe was inserted into the gravel and water rose up the pipe to reach a level of 2 m above the top of the clay ( Fig. 2.13).
The clay has a particle specific gravity of 2.7 and a natural water content of 30%. The permeability of the silty clay is 3.0 × 10 −8m/s.
It is proposed to excavate 2 m into the soil to insert a wide foundation which, when constructed, will exert a uniform pressure of 100 kPa on to its supporting soil.
Determine:
1 the unit rate of flow of water through the silty clay in m3 per year before the work commences;
2 how safe the foundation will be against heaving: (i) at the end of excavation; (ii) after construction of the foundation.
Solution:
1 Since the head of water in the gravel is greater than the depth of clay above, it follows that the GWT may be assumed to be at the ground surface.Thus,Head of water in clay = 8 mHead of water in gravel = 10 m⇒Head of water lost in clay = 2 mq = AkiConsider a unit area of 1 m2 then:
2 Height of clay left above gravel after excavation = 8 − 2 = 6 mUpward pressure from water on base of clay = 10 × 9.81 = 98.1 kPaDownward pressure of clay = 6 × 19 = 114 kPa.It is clear that the downward pressure exceeds the upward pressure and thus, on the face of it, the foundation will not be lifted by the buoyant effect of the upward‐acting water pressure, i.e. it is safe. We can quantify how ‘safe’ the foundation is against buoyancy by introducing the term factor of safety, F:Downward pressure after construction = 114 + 100 = 214 kPai.e. the factor of safety against buoyant uplift is higher after construction.We can also assess the safety against buoyancy using the limit state design approach defined in Eurocode 7 (see Chapter 6). The solution to Example 2.6when assessed in accordance with Eurocode 7 is available for download from the companion website.
Читать дальшеИнтервал:
Закладка:
Похожие книги на «Smith's Elements of Soil Mechanics»
Представляем Вашему вниманию похожие книги на «Smith's Elements of Soil Mechanics» списком для выбора. Мы отобрали схожую по названию и смыслу литературу в надежде предоставить читателям больше вариантов отыскать новые, интересные, ещё непрочитанные произведения.


Обсуждение, отзывы о книге «Smith's Elements of Soil Mechanics» и просто собственные мнения читателей. Оставьте ваши комментарии, напишите, что Вы думаете о произведении, его смысле или главных героях. Укажите что конкретно понравилось, а что нет, и почему Вы так считаете.