Marja-Liisa Siikonen - People Flow in Buildings
Здесь есть возможность читать онлайн «Marja-Liisa Siikonen - People Flow in Buildings» — ознакомительный отрывок электронной книги совершенно бесплатно, а после прочтения отрывка купить полную версию. В некоторых случаях можно слушать аудио, скачать через торрент в формате fb2 и присутствует краткое содержание. Жанр: unrecognised, на английском языке. Описание произведения, (предисловие) а так же отзывы посетителей доступны на портале библиотеки ЛибКат.
- Название:People Flow in Buildings
- Автор:
- Жанр:
- Год:неизвестен
- ISBN:нет данных
- Рейтинг книги:4 / 5. Голосов: 1
-
Избранное:Добавить в избранное
- Отзывы:
-
Ваша оценка:
People Flow in Buildings: краткое содержание, описание и аннотация
Предлагаем к чтению аннотацию, описание, краткое содержание или предисловие (зависит от того, что написал сам автор книги «People Flow in Buildings»). Если вы не нашли необходимую информацию о книге — напишите в комментариях, мы постараемся отыскать её.
People Flow in Buildings Readers will also benefit from the inclusion of:
A thorough introduction to people-counting methods, including counting technology inside and outside buildings, passenger traffic components, and manual people-counting An examination of the passenger arrival process in building, including the Poisson arrival process and probability density function, and passenger arrivals in batches A consideration of daily vertical passenger traffic profiles, including two-way traffic profiles and the effects of inter-floor traffic An exploration of people flow solutions, including stairs, escalators, and elevators with collective and destination group control systems, as well as double-deck and multicar system People flow calculation and simulation models Elevator planning with ISO simulation method Elevator planning and evacuation of tall buildings Perfect for software designers in the private sector and academia,
will also earn a place in the libraries of elevator consultants, manufacturers, and architects who seek a one-stop reference for transportation devices from a functional and design perspective, as opposed to a hardware perspective.
People Flow in Buildings — читать онлайн ознакомительный отрывок
Ниже представлен текст книги, разбитый по страницам. Система сохранения места последней прочитанной страницы, позволяет с удобством читать онлайн бесплатно книгу «People Flow in Buildings», без необходимости каждый раз заново искать на чём Вы остановились. Поставьте закладку, и сможете в любой момент перейти на страницу, на которой закончили чтение.
Интервал:
Закладка:
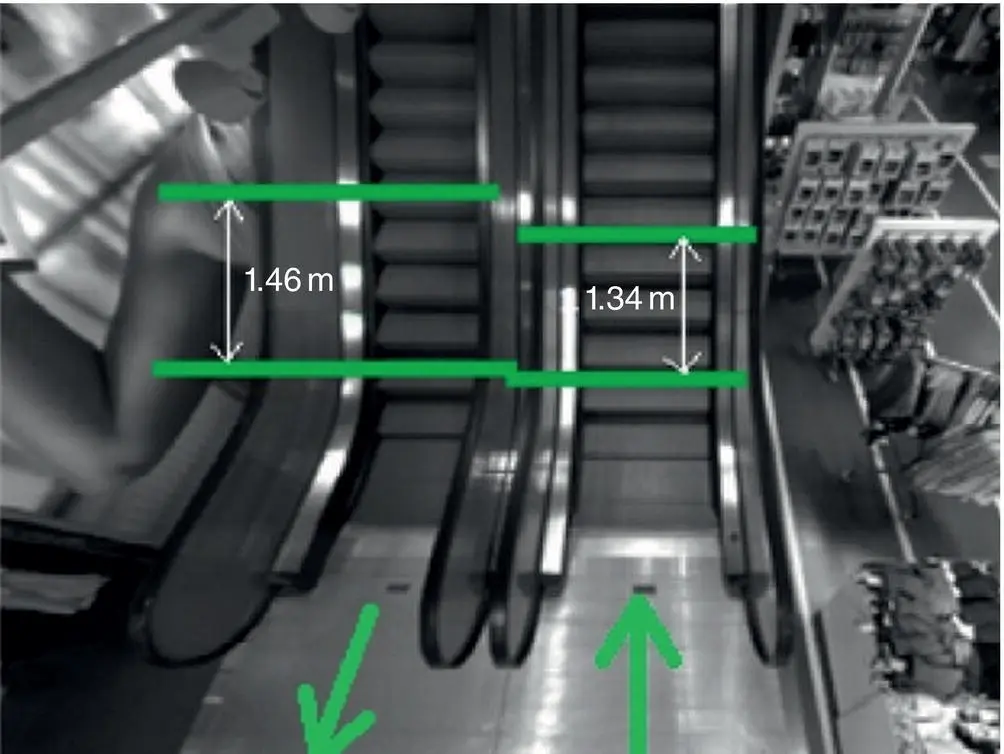
Figure 3.8 Setup of people flow counting in escalators
( Source: Uimonen et al. 2016. © Elsevier).
3.3.3 Observed Batch Sizes in Several Building Types
In his study, Kuusinen suggested further studies on the matter to be able to generalize the results. That is why the batch size study was extended to offices, hotels and residential buildings covering different continents and cultures (Sorsa et al. 2021). The daily traffic was observed in elevator lobbies with a pen and paper method in 2013–2014. Table 3.3includes a summary of the building and measurement data. The measurement was made for 12 hours using a manual data collection template. The collected data include the building name, number of served floors by elevators, elevator group size, design population and passenger batch sizes with their arrival times. Batch size estimations were based on observer judgment where a batch consisted of colleagues or friends discussing with each other or family members moving together. For the manual counting, the social passenger batch was defined as a group of people who
1 arrive at the same time
2 move together or discuss with each other
3 enter the same car.
Table 3.3 Summary of observed office, hotel and residential building daily data.
| Building location | Time of day | No. of person trips/day | No. of batches/day | Mean batch size/day (persons) |
|---|---|---|---|---|
| Offices | ||||
| FIN | 8:00–20:00 | 2717 | 2289 | 1.2 |
| SIN | 8:00–20:00 | 5514 | 4261 | 1.3 |
| UAE | 7:00–19:00 | 2699 | 2169 | 1.2 |
| USA1 | 8:00–20:00 | 3389 | 2917 | 1.2 |
| Daily average | 1.2 | |||
| Hotels | ||||
| SIN1 | 8:00–19:00 | 5128 | 2595 | 2.0 |
| UAE1 | 9:00–20:00 | 2650 | 2008 | 1.3 |
| Daily average | 1.7 | |||
| Residential buildings | ||||
| FIN1 | 7:00–19:00 | 318 | 284 | 1.1 |
| SIN2 | 8:00–20:00 | 705 | 512 | 1.4 |
| UAE2 | 7:00–19:00 | 965 | 763 | 1.3 |
| Daily average | 1.3 | |||
| Commercial buildings (escalators) | ||||
| FIN2 | 7:00–21:00 | 1.2 |
The batch sizes were observed from four globally selected office buildings, two hotels and three residential buildings as shown in Figure 3.9. The observations were made for 12‐hour periods in elevator lobbies, normally starting at 8:00 o'clock in the morning as shown in Table 3.3(Sorsa et al. 2021). The measurements of batches in commercial building were made from escalator entrances (Uimonen et al. 2017). Social groups and their sizes were recognized also from one‐hour video recording of a security camera in a cruise ship (Sorsa and Siikonen 2014). The recording was made during embarkation where people used elevators and stairs.
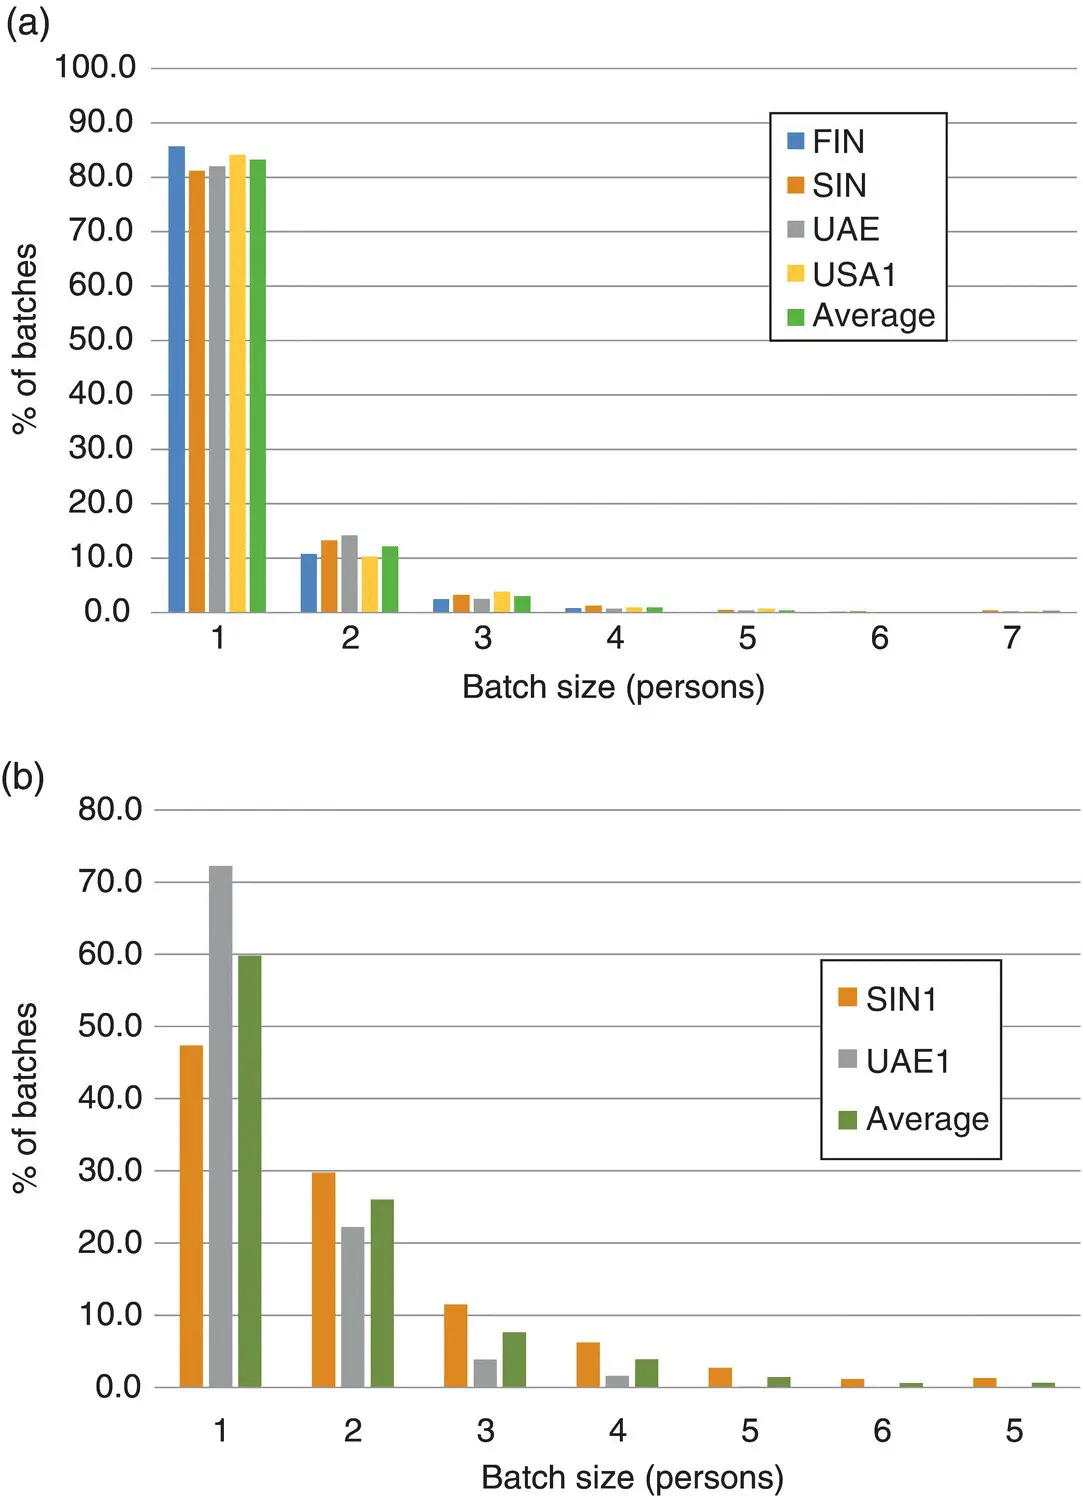
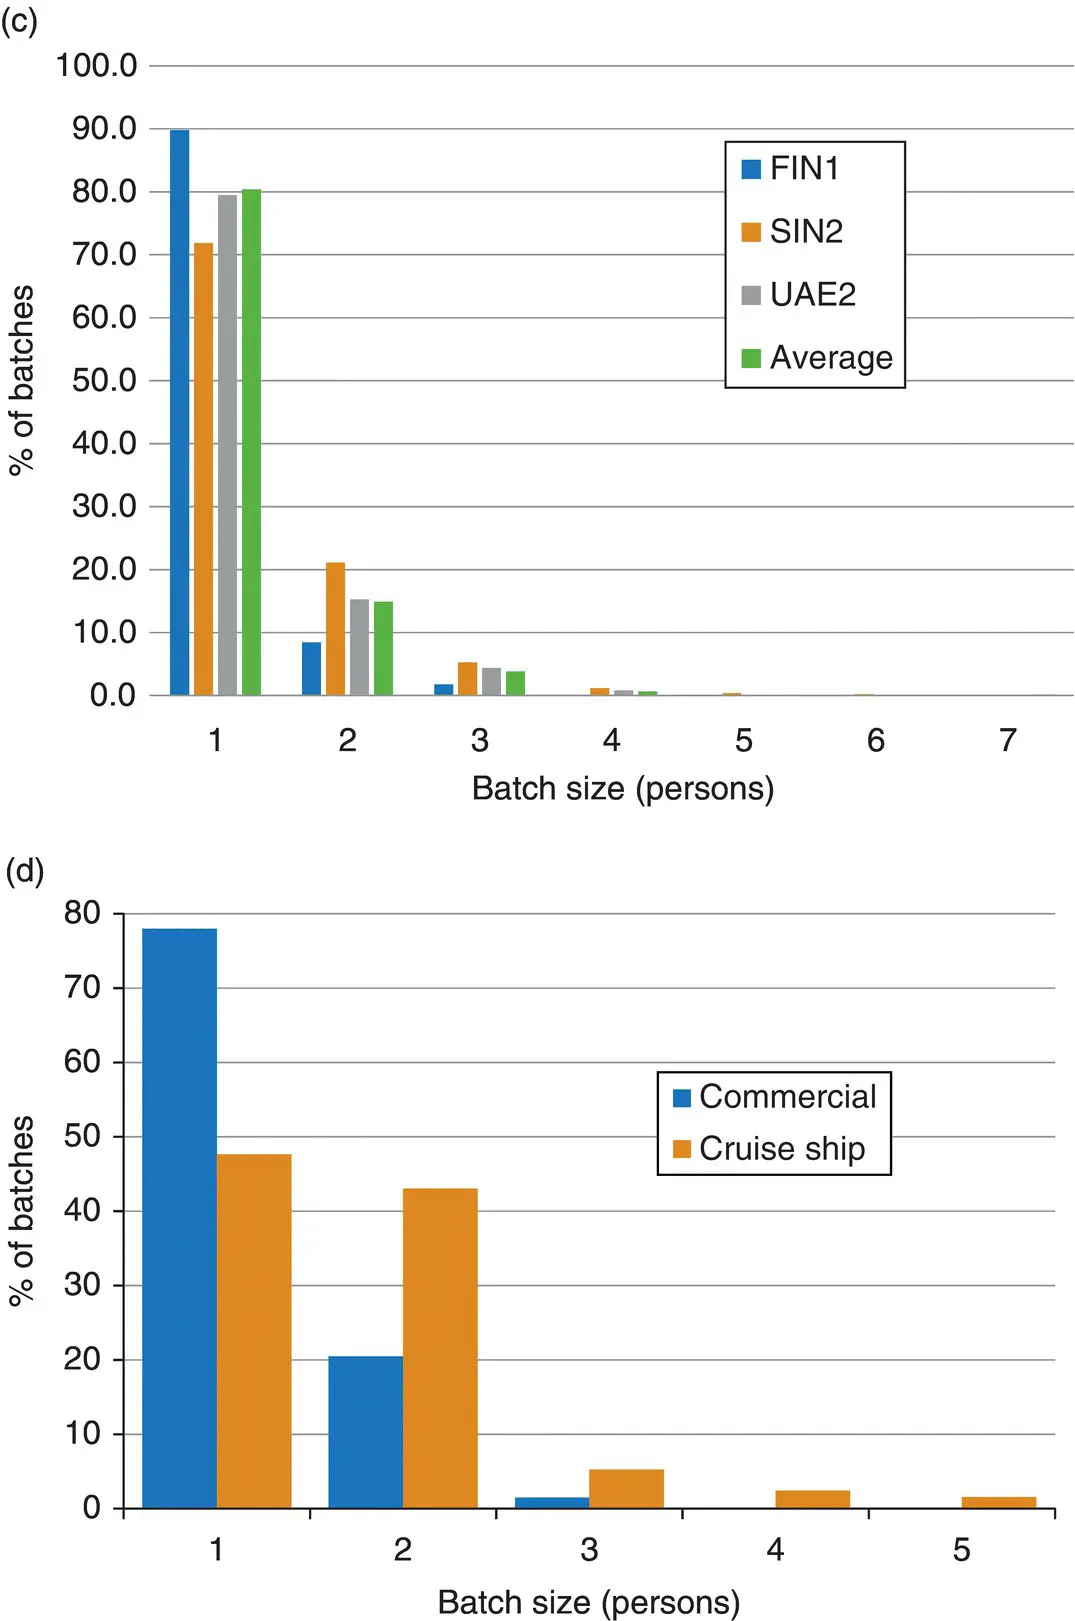
Figure 3.9 Observed daily passenger batch size distributions of the globally selected office buildings (a), hotels (b), residential buildings (c), and a commercial building and a cruise ship (d).
The gender of the persons was recorded in Dubai and San Francisco but unfortunately not in the other countries. According to the recordings, 60–75% of the observed person trips in those countries were made by males, and 25–40% by females. The mean and average batch sizes of all buildings are analysed in Table 3.3. In general terms, the measured mean passenger batch sizes in different types of buildings vary between one and two persons on average. The social groups inside buildings seem to be smaller than pedestrian groups outside buildings (James 1953; Coleman and James 1961; Moussaïd et al. 2010).
3.3.4 Batch Size Variation in Elevator Lobbies During the Day
Observed frequencies of different batch sizes during the measurement period are shown in Figure 3.9. The batch size distribution for all four globally selected office buildings looks surprisingly similar with the mean batch size of 1.2 persons ( Figure 3.9a). For the hotels, there is great variation in the batch sizes with the mean of 1.7 persons, see Figure 3.9b. The hotel in Singapore is for family and holiday use and the mean daily batch size is greater, about two persons. The hotel in UAE is a business hotel with smaller passenger batches. The average batch size in residential buildings is 1.3 persons where the batch sizes vary somewhat depending on the culture. In Finland, passengers move mostly alone with a mean batch size of 1.1 persons while in Singapore the mean batch size is 1.4 persons, see Figure 3.9c.
For offices, 82–84% of the number of batches were individual arrivals with a mean batch size of 1.2 persons. This confirms earlier results obtained in offices (Sorsa et al. 2013). During lunch time, the portion of individual arrivals was only about 75 % with a mean batch size of 1.4 persons, which is close to the 1.5 persons obtained by Kuusinen (2008). These values indicate significant deviation from the traditional assumption that in office buildings passengers arrive and travel alone in elevators.
Hotel guests move with their friends or families. The daily mean social group size varies from 2.0 in Singapore to 1.3 in UAE. About 50–75% of the batch arrivals are individual with mean batch size of 1.7 persons, which is much bigger than the one recorded from the offices. Peak traffic hour in in Singapore occurs between 15:00 and 17:00 while in UAE it is between 17:00 and 19:00 o'clock.
In residential buildings, the daily mean group size is 1.3 persons during the day, which is slightly higher than for offices. In the afternoon at about 15:00 o´clock, the mean batch size is bigger, 1.5 persons. According to the observations, about 80% of the trips are individual, which is higher than in hotels.
Figure 3.9d shows the batch size distribution in a Finnish shopping centre. In the commercial building, 78% of the batch arrivals were individual whereas in cruise ships the number was 48 %. The mean daily group size in the cruise ship was 1.7 persons. In the hotels and cruise ships, the observed mean batch sizes are the highest. Based on all the observations above, rough values for the mean batch sizes in various types of buildings are proposed in Table 3.4(Sorsa et al. 2021).
Table 3.4 Mean passenger batch size distribution for different times of day.
| Type | Traffic pattern | Mean batch size |
|---|---|---|
| Office | Up‐peak | 1.0 |
| Lunch‐peak | 1.5 | |
| Hotel – business | Two‐way | 1.5 |
| Hotel – resort | Two‐way | 2.0 |
| Residential | Two‐way | 1.5 |
| Commercial | Two‐way | 1.2 |
| Cruise ships | Incoming | 1.7 |
3.3.5 Modelling of Batch Size Distribution
Интервал:
Закладка:
Похожие книги на «People Flow in Buildings»
Представляем Вашему вниманию похожие книги на «People Flow in Buildings» списком для выбора. Мы отобрали схожую по названию и смыслу литературу в надежде предоставить читателям больше вариантов отыскать новые, интересные, ещё непрочитанные произведения.


Обсуждение, отзывы о книге «People Flow in Buildings» и просто собственные мнения читателей. Оставьте ваши комментарии, напишите, что Вы думаете о произведении, его смысле или главных героях. Укажите что конкретно понравилось, а что нет, и почему Вы так считаете.