Marja-Liisa Siikonen - People Flow in Buildings
Здесь есть возможность читать онлайн «Marja-Liisa Siikonen - People Flow in Buildings» — ознакомительный отрывок электронной книги совершенно бесплатно, а после прочтения отрывка купить полную версию. В некоторых случаях можно слушать аудио, скачать через торрент в формате fb2 и присутствует краткое содержание. Жанр: unrecognised, на английском языке. Описание произведения, (предисловие) а так же отзывы посетителей доступны на портале библиотеки ЛибКат.
- Название:People Flow in Buildings
- Автор:
- Жанр:
- Год:неизвестен
- ISBN:нет данных
- Рейтинг книги:4 / 5. Голосов: 1
-
Избранное:Добавить в избранное
- Отзывы:
-
Ваша оценка:
People Flow in Buildings: краткое содержание, описание и аннотация
Предлагаем к чтению аннотацию, описание, краткое содержание или предисловие (зависит от того, что написал сам автор книги «People Flow in Buildings»). Если вы не нашли необходимую информацию о книге — напишите в комментариях, мы постараемся отыскать её.
People Flow in Buildings Readers will also benefit from the inclusion of:
A thorough introduction to people-counting methods, including counting technology inside and outside buildings, passenger traffic components, and manual people-counting An examination of the passenger arrival process in building, including the Poisson arrival process and probability density function, and passenger arrivals in batches A consideration of daily vertical passenger traffic profiles, including two-way traffic profiles and the effects of inter-floor traffic An exploration of people flow solutions, including stairs, escalators, and elevators with collective and destination group control systems, as well as double-deck and multicar system People flow calculation and simulation models Elevator planning with ISO simulation method Elevator planning and evacuation of tall buildings Perfect for software designers in the private sector and academia,
will also earn a place in the libraries of elevator consultants, manufacturers, and architects who seek a one-stop reference for transportation devices from a functional and design perspective, as opposed to a hardware perspective.
People Flow in Buildings — читать онлайн ознакомительный отрывок
Ниже представлен текст книги, разбитый по страницам. Система сохранения места последней прочитанной страницы, позволяет с удобством читать онлайн бесплатно книгу «People Flow in Buildings», без необходимости каждый раз заново искать на чём Вы остановились. Поставьте закладку, и сможете в любой момент перейти на страницу, на которой закончили чтение.
Интервал:
Закладка:
A Chi‐square homogeneity test is done to discover if the arrivals through the turnstiles follow a Poisson process. The test is applied to the automatically recorded data for the traffic peak periods of one hour. Each traffic period is analysed for intervals t of 10, 30, 60 and 300 seconds. The expected frequency, e i, of passenger groups with k ipersons within interval t is
(3.2) 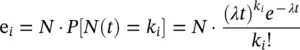
where e ifollows Poisson process. N is the sum of the frequencies f iof all groups K during the interval
(3.3) 
Index i = 1,2, …,K refers to the recorded passenger group sizes during the analysed period. The arithmetic mean of the group sizes is calculated from the recorded data as
(3.4) 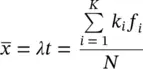
The variance of the recorded group arrivals, σ 2, is respectively
(3.5) 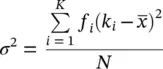
A Chi‐square – test is performed for the recorded group arrival frequencies f i,and the expected group frequencies e i
(3.6) 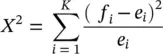
In the null hypothesis H 0, we assume that passenger arrivals follow a Poisson distribution with a significance level of 0.05. The null hypothesis is accepted if the calculated value of Eq. (3.6)is less than the critical value of X 2 0,05., and bigger than X 2 0,95. To find critical values for the distribution, the degrees of freedom, n , during an interval is defined as the number of the analysed passenger groups minus one. The X 2 ‐ test is done separately for the people entering and exiting during the whole day, during the morning up‐peak between 8:00 and 9:00 o’clock and in the evening down‐peak between 17:00 and 18:00 o’clock. The analysis results for the passengers entering the elevator lobby are shown in Table A.2 and Table 3.1, and for the people exiting in Table A.3 and Table 3.2, respectively.
According to the Chi‐squared test, in this office building the individual passenger arrivals through the security gates follow a Poisson process only during very light traffic. H 0‐hypothesis applies only for the entering passenger traffic in the evening and for the departing passenger traffic in the morning. These traffic components are opposite to the main people flow through the turnstiles. For whole day and for heavy traffic peaks, the H 0‐hypothesis is rejected. With heavy traffic, the randomness of passenger arrivals may be disturbed by the turnstiles, especially in the analysis of 10‐second intervals. Thus, most time of the day the assumption that passenger arrivals through turnstiles follow Poisson process is not true.
3.3 Passenger Arrivals in Batches
3.3.1 Batch Arrivals in Elevator Lobbies
Early theoretical studies have already recognized that elevators give limitations to passenger traffic. Passenger arrivals in bulks in a single‐server elevator system were studied by Bailey (1954). The passenger capacity, c, of an elevator limits the number of passengers that can be transported with one server. Later, Miller (1959) studied the single‐elevator system where passengers arrived in batches rather than individually. According to Miller, the theory based on individual passenger arrivals cannot be applied to an elevator system.
Kuusinen (2008) revised the study of Alexandris for passenger arrival process in a multi‐storey office building using digital video recordings. He used video footage together with the data that were simultaneously logged by the elevator monitoring system. The passenger data included time stamps of passenger arrival times, and their arrival and destination floors. The video recordings were synchronized with the monitored data. Additional data of the passengers’ social behaviour were collected from the staff with a questionnaire. The study was made in an office building with two entrances where video cameras were placed on both elevator entrance floors ( Figure 3.6).
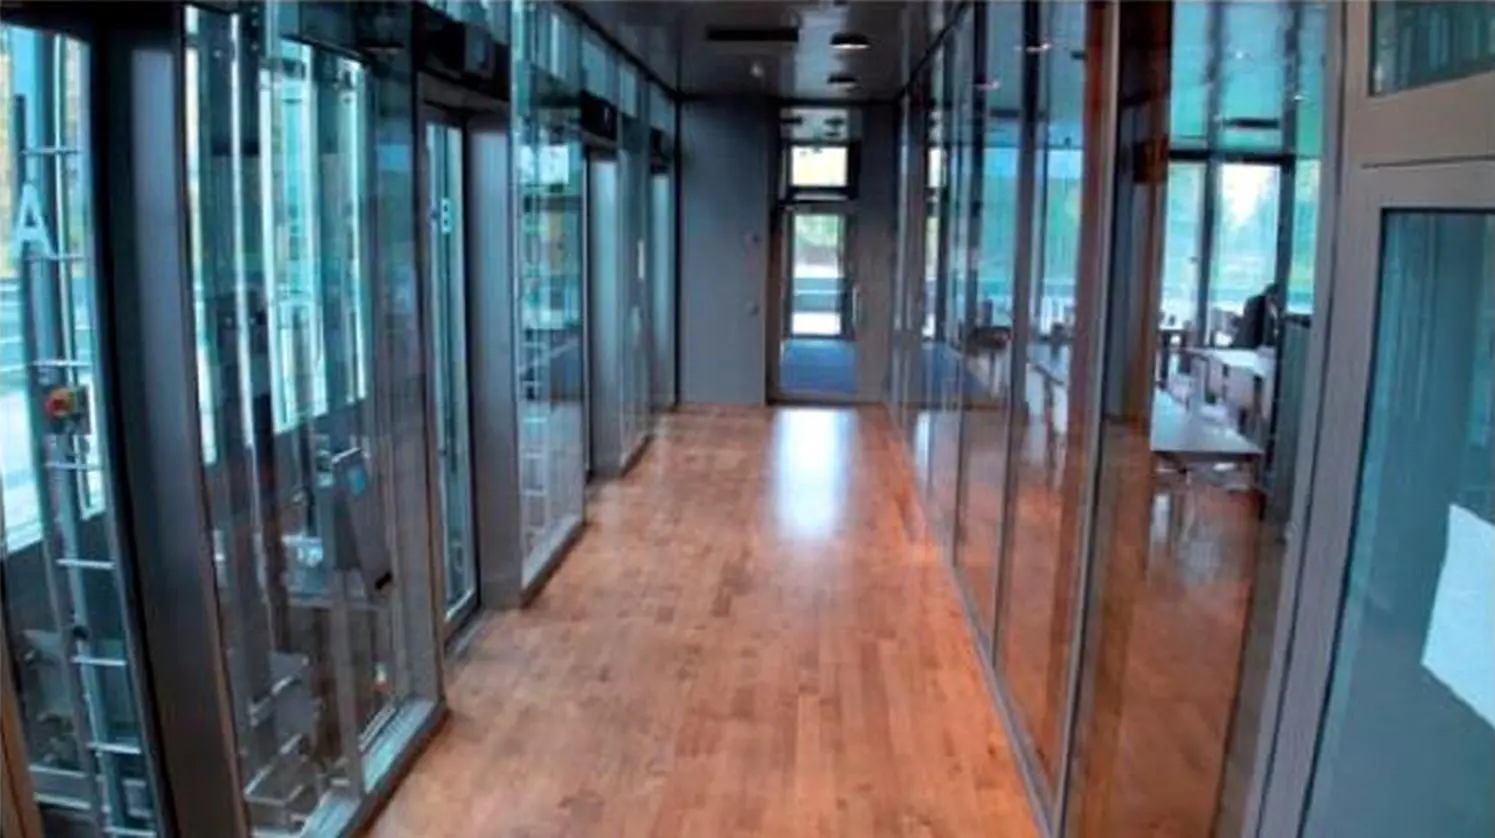
Figure 3.6 A snapshot of a video recording from the first entrance floor
( Source: Kuusinen et al. (2012). © SAGE Publications, Inc.).
People arriving in and departing from the elevator lobby were categorized into groups of one, two, three, etc. persons. In the study, a passenger batch is defined as people travelling together with their friends. Passenger batch consists of people who
1 arrive in the elevator lobby at the same time
2 arrive in the lobby from the same direction
3 enter the same elevator
4 travel together with the same elevator
5 exit the elevator on the same destination floor.
The measurement data were analysed especially for the morning up‐peak, beginning and end of lunch hour and for the evening down‐peak. The test period was partitioned into minute intervals to guarantee a sufficient number of observations. According to the questionnaires, the average batch size was 1.5, 3.3, 3.7 and 1.3 passengers for morning up‐peak, lunch down‐peak, lunch up‐peak and evening down‐peak, respectively. The batch size distributions from the video recordings showed that in the morning, about 80% of passengers arrived individually with a batch size of 1.1 persons (Kuusinen et al. 2012). Figure 3.7shows the cumulative number of individual and batch arrivals at the entrance floor during lunch hour. When returning from lunch time, about 50% of the arrivals were batches of two or more persons with the average size of 1.5 persons.
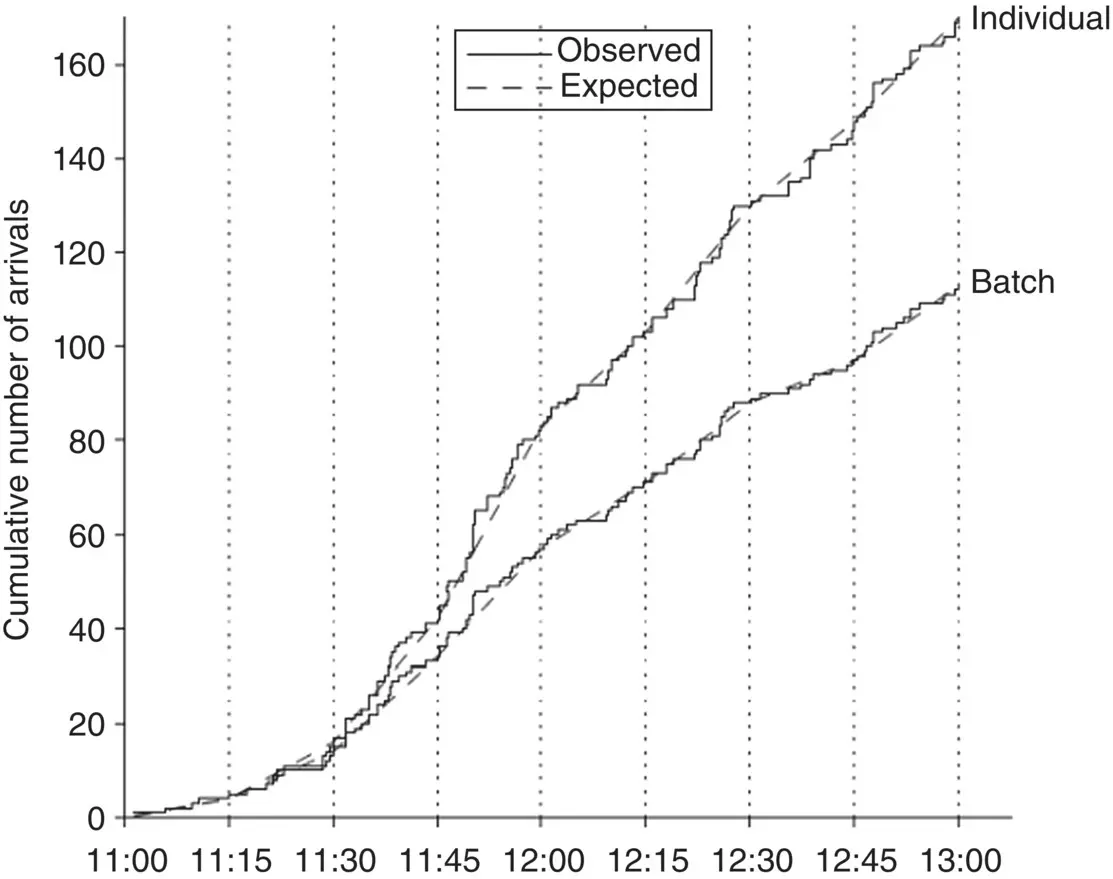
Figure 3.7 Cumulative number of batch and individual arrivals at the entrance floor during lunch hour
( Source: Kuusinen et al. (2012). © 2012, SAGE Publications).
Kuusinen applied the test of Brown et al. (2005) to find out whether the batch arrivals could be modelled with a Poisson process (Kuusinen 2015). The conclusion of the test was that in the morning up‐peak, passenger batch arrivals follow a Poisson process better than the individual passenger arrivals. Batch arrivals follow a Poisson process also during lunch hour, which was not the case for individual passenger arrivals.
3.3.2 Batch Arrivals in Escalators
The number of passengers using escalators was measured using two stereo cameras that were installed in the same plane as the inclined floor of the escalator (Uimonen, 2015). The sensors were placed directly over the entrance of the ascending escalator. People flow counting was made with the help of projection lines, see Figure 3.8(Uimonen et al. 2016). Accurate time stamps were used to estimate passenger batch sizes. People were assumed to arrive in a batch if they entered the escalator within a three‐second period. Some error in counting was caused by people moving in the groups, or when a tall person was hiding a smaller one.
Читать дальшеИнтервал:
Закладка:
Похожие книги на «People Flow in Buildings»
Представляем Вашему вниманию похожие книги на «People Flow in Buildings» списком для выбора. Мы отобрали схожую по названию и смыслу литературу в надежде предоставить читателям больше вариантов отыскать новые, интересные, ещё непрочитанные произведения.


Обсуждение, отзывы о книге «People Flow in Buildings» и просто собственные мнения читателей. Оставьте ваши комментарии, напишите, что Вы думаете о произведении, его смысле или главных героях. Укажите что конкретно понравилось, а что нет, и почему Вы так считаете.