1 ...6 7 8 10 11 12 ...16 Table 1.4 Typical occupancy factors in hospitals.
| Usage |
Occupancy factor |
Typical occupancy factor |
| Staff |
1.5 … 3 persons/bed space |
3 persons/bed space |
| Visitors |
1–3 visitors/bed space |
3 visitors/bed space |
1.6 Other Types of Populated Buildings
Some buildings can have occasional population where people, for example, attend some event or lecture. Such buildings as stadiums, theatres, tall school or university buildings and the like provide seats or desks for the people. In these types of buildings the design population corresponds to the number of seats. In a stadium, the audience enters the building at the beginning of an event, or exits the stadium after the event. The average people flow is the capacity of the stadium within the time people are allowed to enter or exit the space. The peak traffic in schools can be estimated from the number of students in classroom and the duration of a break. Often students have to switch classrooms during a break, and the maximum flow can be estimated from these figures. If the next lecture is on another floor, the students have to switch floors, which creates sudden vertical traffic peaks.
Similar building tenants are observation decks and restaurants where people visit for an average period. There, the average people flow is obtained from the capacity of the space, and the duration of the visit. For observation decks, the traffic is two‐way. The same amount of people enter and exit the observation deck.
2 People Counting Methods
People flow is the force that keeps transportation devices moving in buildings. Just one person is able to get an elevator or an escalator moving. The reason for dispatching elevators to some floor or start escalators is to transport the arriving passengers. Runs without passenger load should be minimized to save energy. The intensity and type of people flow in the building affect the wear of the transportation device component and the passenger service level fluctuations. In this context, traffic related to transportation devices or vehicles is referred to as passenger traffic, and all pedestrian traffic inside and outside a building as people flow.
Buildings can be classified to mass transit stations without permanent occupancy and occupied buildings. In the non‐occupied buildings, such as shopping centers or transit stations, people just move through the spaces without permanent stay. The design is based on the estimated people flow. In train stations and airports people arrive in pulses, whereas in retail and shopping centres popular times of the day can be detected. In the mass transit stations most of the traffic is handled by escalators. The transportation devices are in use most time of the day, causing a high number of starts per day. People flow estimations can be based on train, bus or airplane schedules and capacities, or in shopping centres e.g. on the cash flow, or on characteristic traffic profiles as explained in Section 4.11. In the following, the methods how to measure passenger traffic in occupied buildings is shortly described.
2.1 Counting Technology Inside and Outside Buildings
Vertical passenger traffic can be measured manually, with access control systems, with elevator monitoring systems, with Automatic Passenger Counting ( APC ), with mobile devices, or with external counting devices. Passenger‐counting data is often provided by agencies or consultants to support building property management, but also transportation device suppliers offer this type of data. Passenger traffic measured from elevators, escalators and stairs gives a comprehensive picture of the vertical traffic and occupation in a building. Hall calls given by passengers in the lobby or car calls given inside the car correlate with the number of passenger trips. This information cannot be directly used in passenger counting since all passengers do not need to give a call. With additional logic of elevator trip data, passenger origin and destination floors can be deduced, and the number of people can be estimated quite accurately (Kuusinen 2015 ). With destination control every passenger are supposed give a call, and can thus provide more accurate information of passenger arrivals, vertical movement and waiting and journey times in elevators. The information is accurate if all passengers give the calls which is not always the case. Floor‐based service‐level data gives information about floor utilization and passenger waiting times for each floor.
Passenger‐counting technologies and procedures of public transportation vehicles have been widely researched. According to the studies, still at the turn of the last millennium, manual counting with paper and pen was the most popular method in traffic studies. Agencies following their own data collection procedures regardless of the counting technology are specialized in the field. Many agencies rely on combined manual counting and electronic fare collection. Modern ways to count passengers in buses and mass transits is to use electronic registering fareboxes ( ERF ) or smart card technology. When the APC technology is used, the number of employees assigned to passenger counting can be decreased to less than half (Boyle 1998 ). In trains, metros and buses, typically the ridership data, numbers of boarding and alighting persons by stop, and vehicle loading are measured. The ridership per trip or route and per time periods are used to access changes in ridership, to add and to delete vehicle trips, revise routes, and to calculate and adjust performance measures. The ridership can also roughly be estimated from the passenger revenue. The organizational units use system‐level data, e.g. budget and finance, and segment level analysis. They make high‐level decisions, such as scheduling to adjust running times and the planning of the location of bus shelters.
Vehicle traffic and people flow segmentation into user groups helps to understand the transportation needs. Outside buildings, global positioning system ( GPS) connection can be used, and inside buildings, passenger journeys can be traced with modern mobile phones and wireless network protocols ( Wi‐Fi ) connection, or with APC and electronic devices. User group data helps in defining typical passenger routes and their agenda during the day. Heat maps show the crowded areas on maps or on the building floors. In the planning stage, transport devices can be placed on the most crowded user routes to serve efficiently all user groups and to avoid bottlenecks in traffic. In the following the methods that can be used in people counting mainly inside buildings are briefly described.
2.2 Passenger Traffic Components
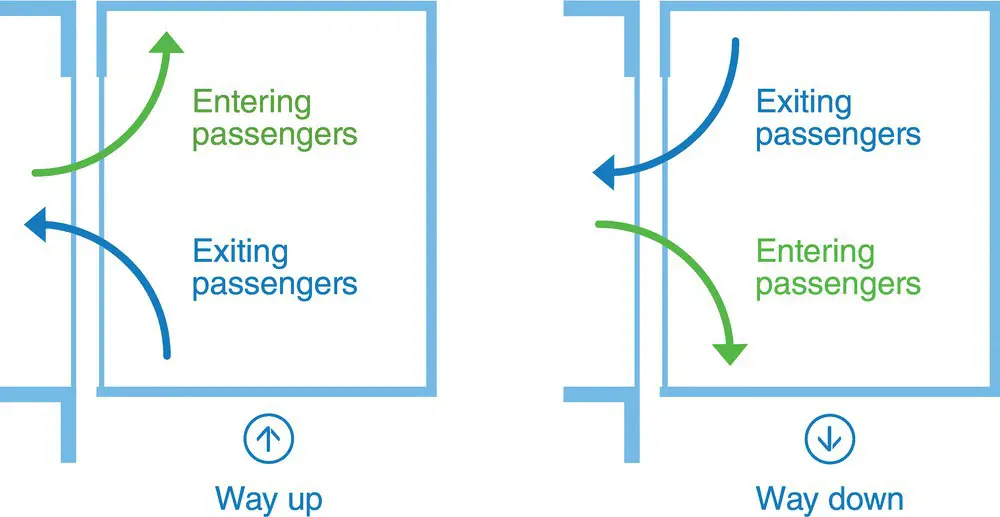
To find out the vertical traffic patterns in buildings, passenger traffic per floor can be divided into four traffic vectors, entering and exiting passengers in and out of the cabin, and whether the passenger is travelling upwards or downwards with the elevator cabin, see Figure 2.1. These four vectors with the passenger arrival time provide sufficient information to reconstruct daily traffic patterns. The four traffic vectors do not have information of the passenger journeys, i.e. their origin and destination floors. With additional elevator status data, it is, however, possible to reconstruct probable passenger origin and destination floors, as shown in Section 21.2. With more accurate measurements individual passenger routes can be followed from origin to destination.

Figure 2.1 Four vectors of passenger traffic per floor
Читать дальше


