The second part of the book concentrates on people flow solutions which affect directly the passenger service quality, such as principles of elevator control systems, passenger access and guidance provided by each control system. This part begins with a historical review from the 1960s and goes shortly through group control technology with relays up to the microprocessor‐based systems. Elevator traffic and control systems were described by Barney et al. in 1970s (Barney and Dos Santos 1977). Group control principles of elevator manufacturers are described on a general level. At first, the group control systems were memoryless, serving one call at a time. With memory, control systems could remember all given hall calls and serve them according to some logic. Full collective control could be used for the up and down calls. With microprocessors, the control systems became more intelligent and could use various mathematical methods in deciding the order in which the elevators could serve the existing calls. In multi‐car systems, where several cars can move in the same shaft, collective control principle can be applied, but mostly the principles are totally different. People flow solutions in buildings also include building doors, escalators, moving walks and staircases, which are briefly reviewed in the second part.
The third part of the book shows calculation methods for handling capacities of transportation devices. Elevator group handling capacity is calculated with uniform and Poisson arrival assumptions with six different approaches for single‐deck elevators, and some theory is introduced also for multi‐car elevator systems. Queuing theory can be used to solve passenger queue lengths and waiting times in simple traffic situations, such as up‐peak. The theory is extended to estimate passenger service times in evacuation traffic. Fruin introduced the theory of pedestrian traffic already in 1970s (Fruin 1987). The density of pedestrians moving through spaces or standing in waiting areas is used to define the level of service. The building spaces should be designed in a manner where the density of people does not become too high. People flow through building doors, stairways, escalators and moving walkways is discussed, and methods on how to calculate their handling capacities are explained. Part IVdescribes building traffic simulation methods. In the elevator traffic simulation, measured people flow profiles are utilized in simulating realistic passenger traffic. For a more realistic vertical traffic simulation, all vertical devices and their control systems and stairs are modelled. In horizontal planning, also doorways, outer and inner walls of the building as well corridors are considered. A usual approach is to feed an expected passenger traffic pattern in the building with predefined set of transportation devices, and study how well the devices can serve the passenger traffic. Simulations have revealed some phenomena of passenger service in certain traffic situations, which are discussed in this part.
The final Part Vconcentrates on planning transportation devices for tall and complex buildings. It describes the new ISO 8100‐32 standard, and the way to apply it. The design of elevators in different types of buildings is shown with examples. Elevator area and space demand with different elevator solutions are compared. After the attack on the World Trade Center on 11 September 2001, people flow planning started also to concentrate on safe transportation of passengers during emergency situations. Real buildings are used to illustrate evacuation scenarios of super tall building projects.
Part I Measured People Flow in Buildings
1 Building Design Population
1.1 Office Building Population
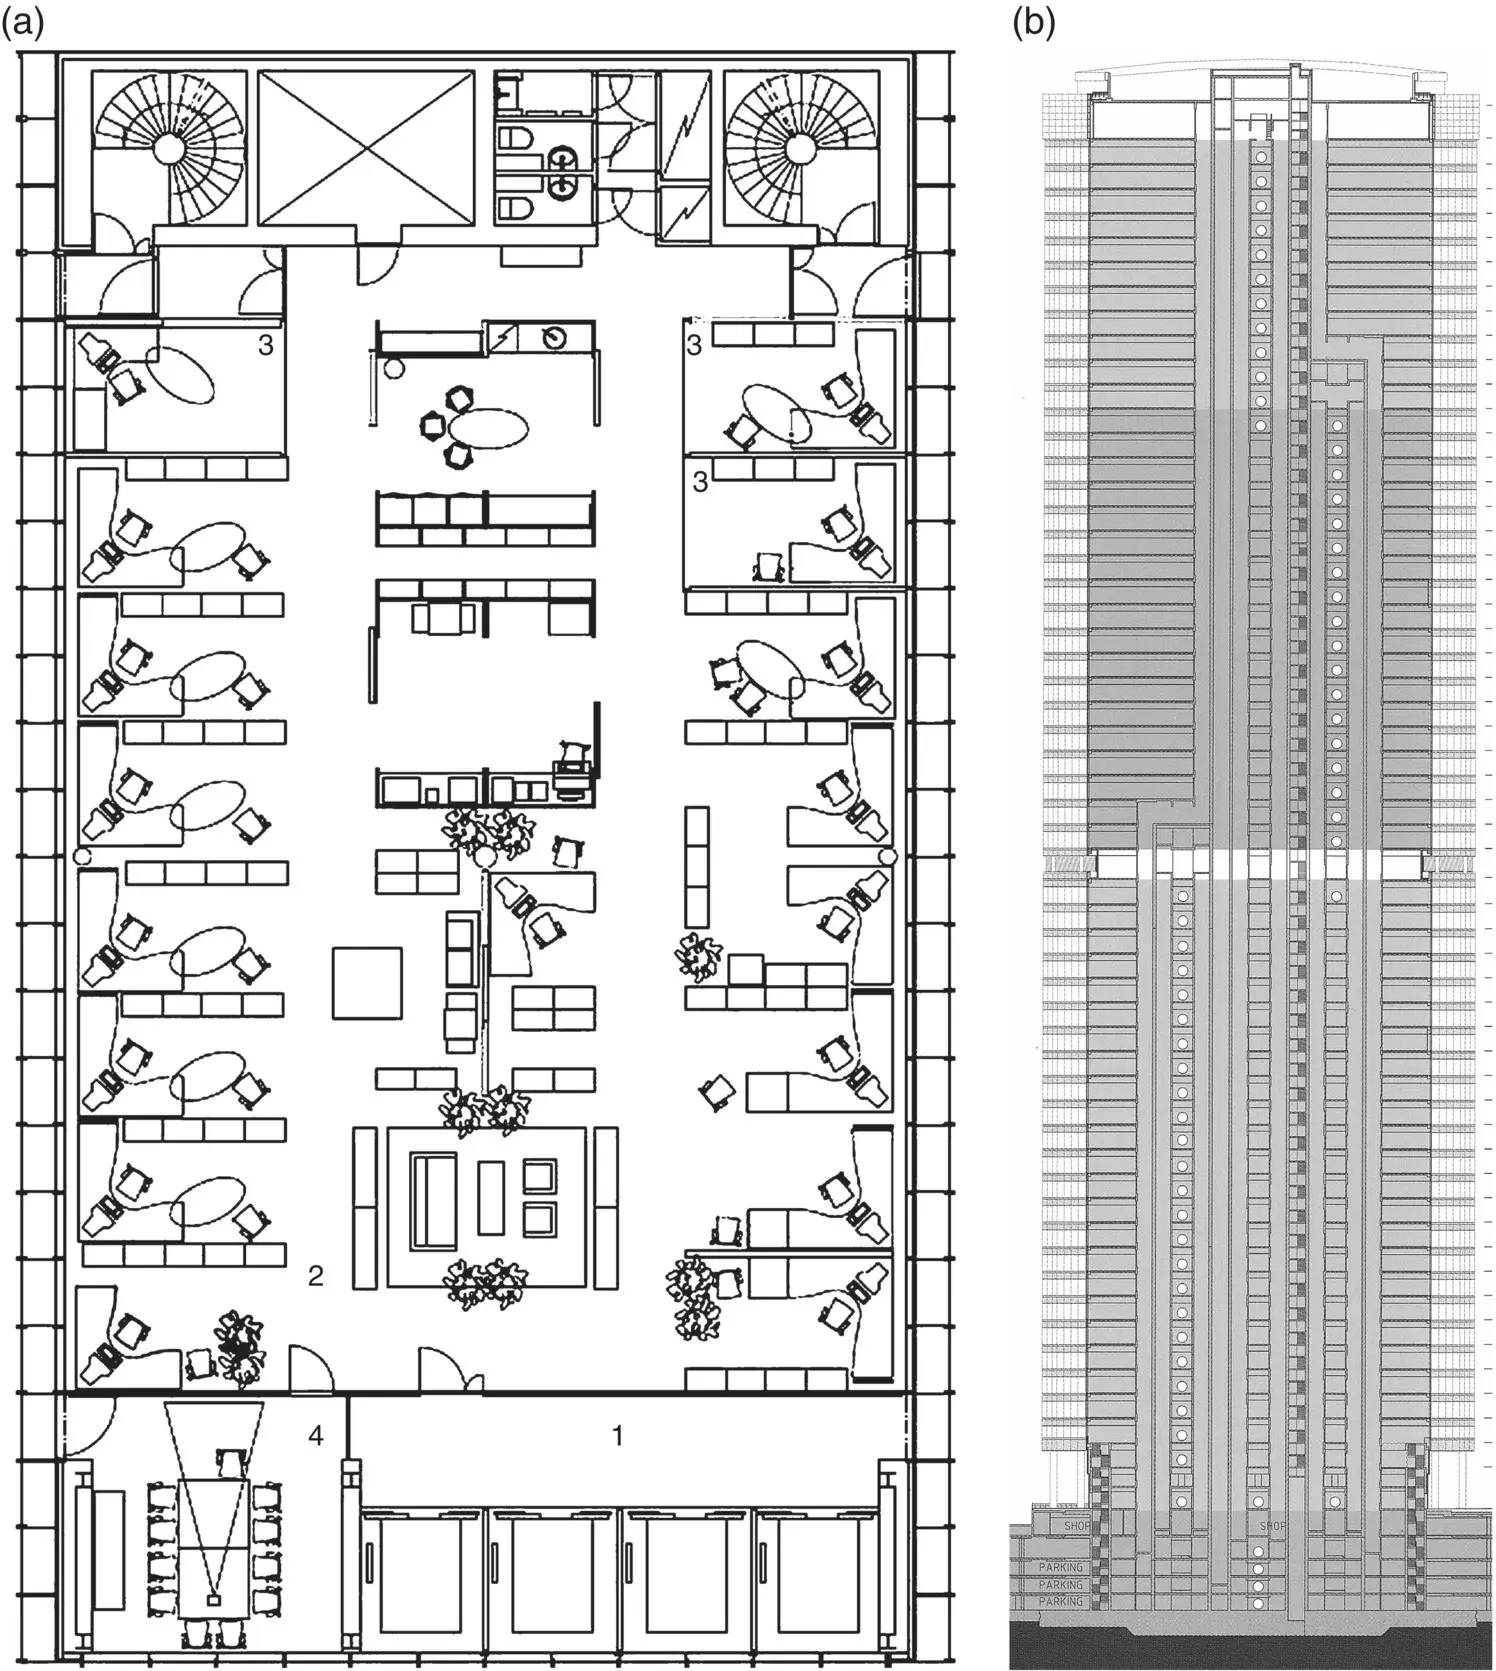
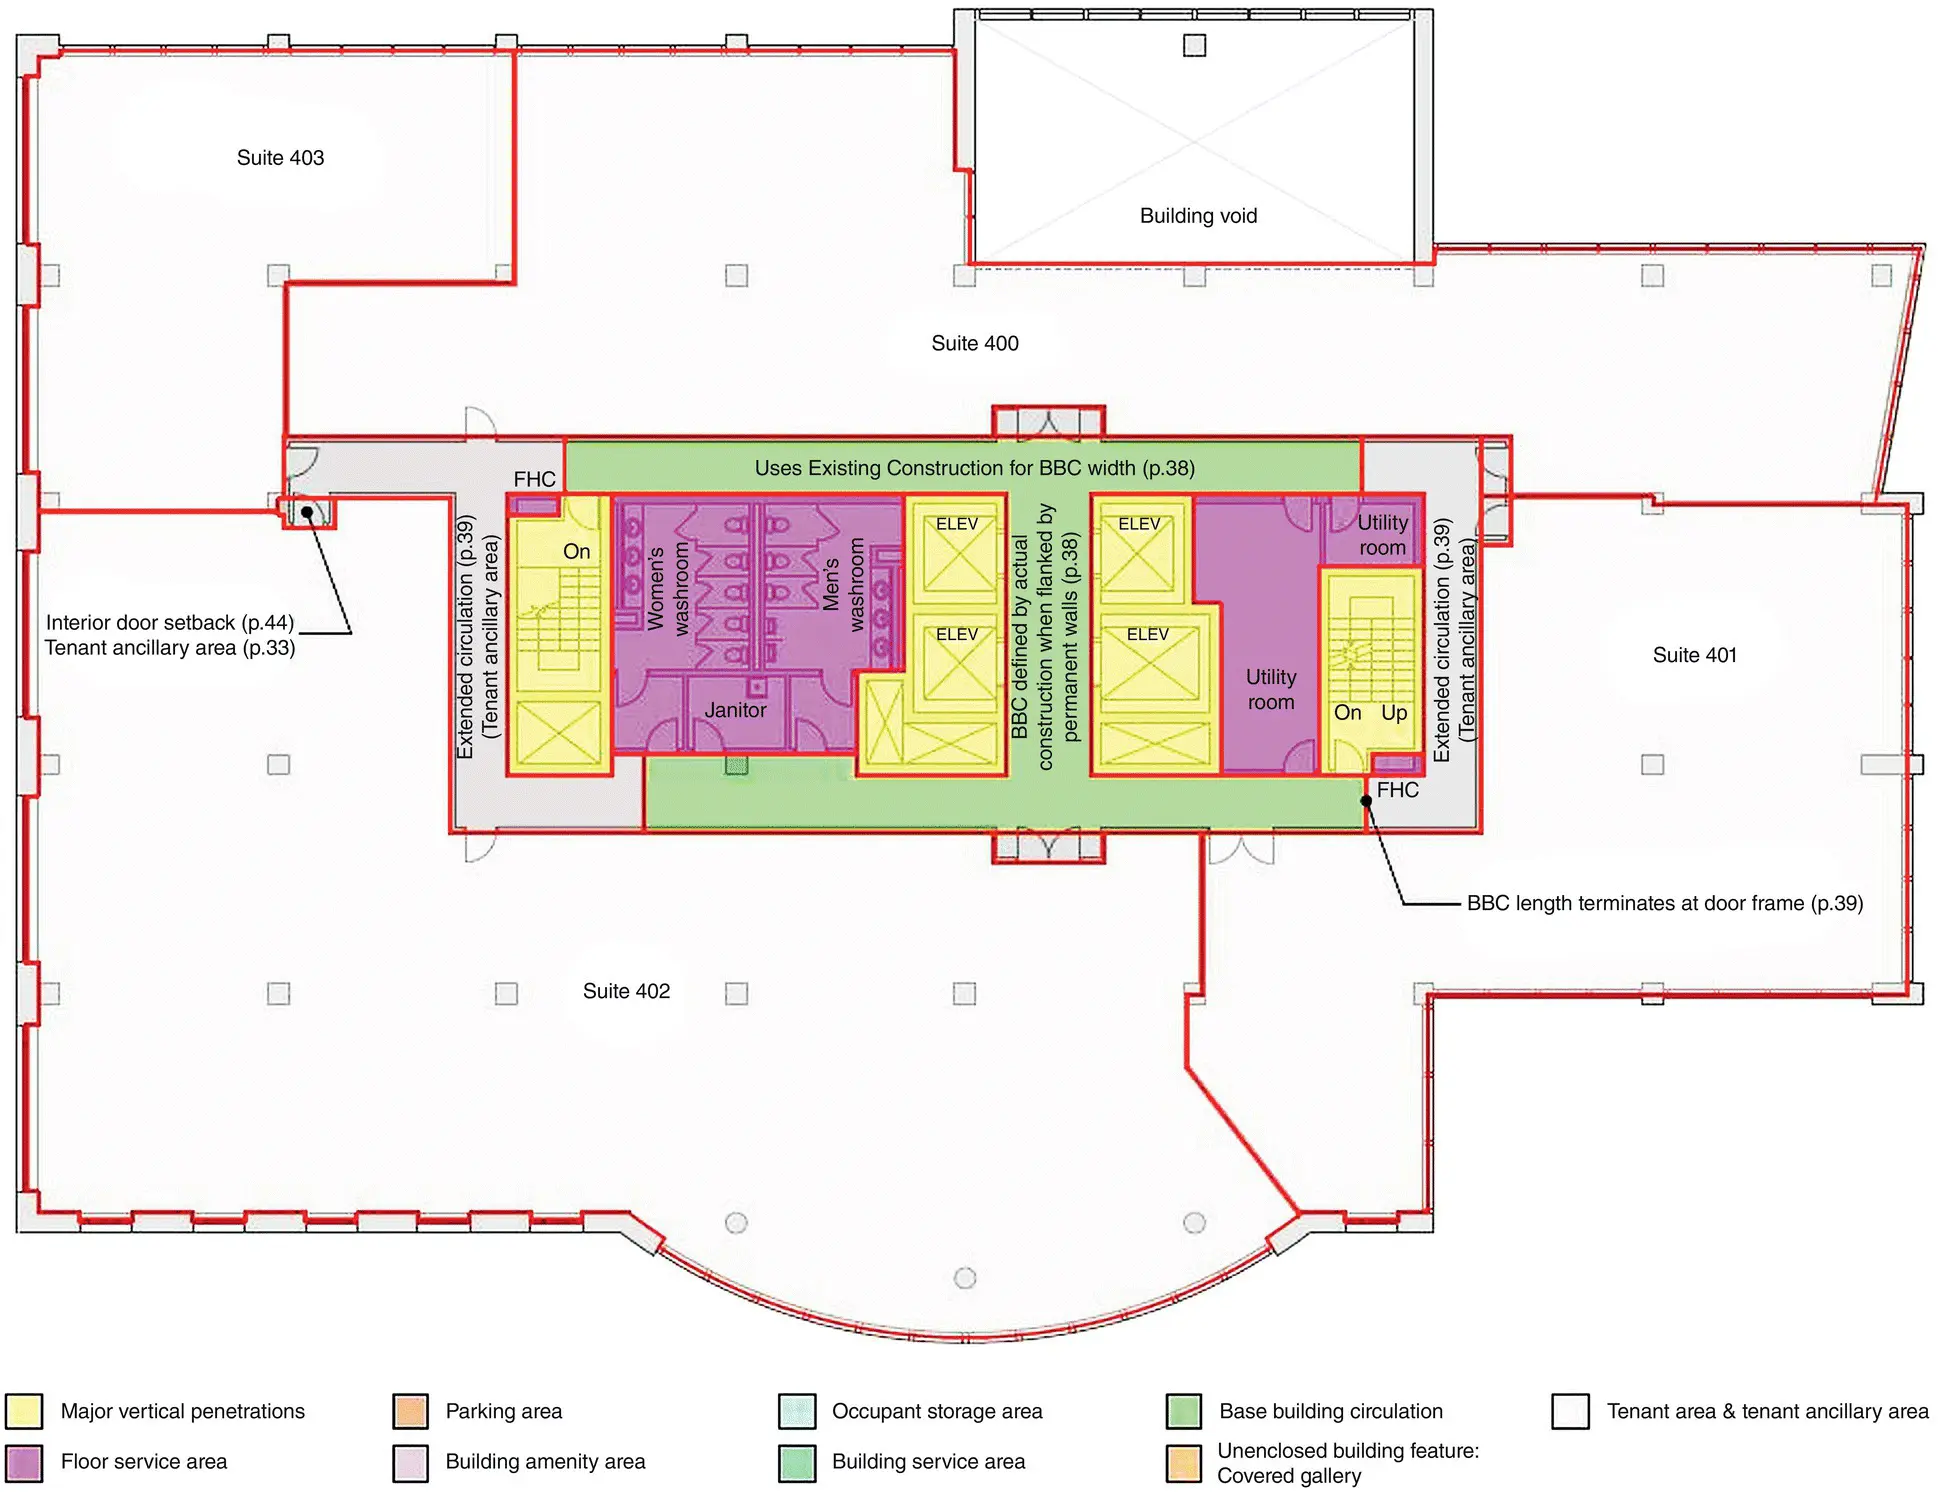
In new buildings, the best way to estimate the population is to utilize the floor layout and gross section drawings. An example of a building layout and gross section drawings is shown in Figure 1.1. From the drawings one can also find out the utilization of floors, and location of entrances, restaurant and meeting rooms, and tenants. Architect gross section drawings show the number of floors, the utilization of floors, and the floor heights. The floor layout drawings give the gross internal area ( GIA ) of the floor, and often also the net area. Net area defines the area suitable for workplaces from which the population is defined. There are slightly different definitions for the floor area, such as rentable area , and effective floor area for occupants (ISO 9836 2017 ). The floor rentable area is the rentable area of each floor before service and amenity areas are proportionately allocated to occupant areas. Occupant area, on the other hand, is the sum of tenant and tenant ancillary areas (Building Owners and Managers Association [BOMA] International 2017 ). The net internal area , NIA, excludes the external walls of the building, and common facilities that do not change, such as stairs, escalators, elevators, toilets and maintenance rooms (International Property Measurement Standards Coalition (IPMSC) 2014 ). Figure 1.2shows BOMA definitions for the tenant area, and the floor service area with major vertical penetrations and base building circulation for an upper floor.

Figure 1.1 An example of a layout drawing with NIA of KONE Building
( Source: SARC Architects (2001))
(a), and a cross section drawing of Naberezhnaya Tower: Сity Center Investment B.V.
( Source: ENKA Group (2003)) (b).

Figure 1.2 Office multi‐occupant floor descriptions for upper floors
( Source: Reprinted with permission, Building Owners and Managers Association (BOMA) International copyright © 2017. All rights reserved)
The workplace area (WA) is an office area that represents the average amount of space allocated as working space for a single person. WA of a person varies according to the tenant type. In prestige offices, the passengers can have their own rooms and the area can vary between 12 and 25 m 2per person. In regular offices, people are packed tighter where the area per person ( APP ) is around 8–12 m 2. In high‐density occupancy floors, such as financial trading and call centre floors, the APP can be 6–8 m 2(Barney 2003 ). The design population, U i, of floor i can be written as
(1.1) 
where UF iis utilization factor of floor i which describes how efficiently the NIA is used for working places (ISO 8100‐32 2020 ). The smaller the UF iis, the smaller the estimated design population of a building, U , becomes. In fully occupied offices, UF ivaries between 80 % and 90 % of the NIA depending on the office building type, see Table 1.1.
Table 1.1 Typical values for building occupation.
Source: ISO 8100‐32 2020 . © John Wiley & Sons.
| Usage |
WA range |
Minimum occupancy factor |
UF (%) |
| Trader floors |
6–8 m 2/person |
6 m 2/person |
90 |
| Open plan |
8–10 m 2/person |
8 m 2/person |
85 |
| Standard |
10–12 m 2/person |
10 m 2/person |
80 |
| Prestige |
12–25 m 2/person |
12 m 2/person |
80 |
NIA is close to the building rentable area (CIBSE 2015 ), which is greater than the net usable area (NUA). Rentable area can be assumed to be 90–95% of GIA while NUA is 80–85% of rentable area. With these assumptions, Eq. (1.1) can be written, e.g. as Ui = 0.9· UF i· GIA i/ WA i.
Читать дальше


