Marja-Liisa Siikonen - People Flow in Buildings
Здесь есть возможность читать онлайн «Marja-Liisa Siikonen - People Flow in Buildings» — ознакомительный отрывок электронной книги совершенно бесплатно, а после прочтения отрывка купить полную версию. В некоторых случаях можно слушать аудио, скачать через торрент в формате fb2 и присутствует краткое содержание. Жанр: unrecognised, на английском языке. Описание произведения, (предисловие) а так же отзывы посетителей доступны на портале библиотеки ЛибКат.
- Название:People Flow in Buildings
- Автор:
- Жанр:
- Год:неизвестен
- ISBN:нет данных
- Рейтинг книги:4 / 5. Голосов: 1
-
Избранное:Добавить в избранное
- Отзывы:
-
Ваша оценка:
People Flow in Buildings: краткое содержание, описание и аннотация
Предлагаем к чтению аннотацию, описание, краткое содержание или предисловие (зависит от того, что написал сам автор книги «People Flow in Buildings»). Если вы не нашли необходимую информацию о книге — напишите в комментариях, мы постараемся отыскать её.
People Flow in Buildings Readers will also benefit from the inclusion of:
A thorough introduction to people-counting methods, including counting technology inside and outside buildings, passenger traffic components, and manual people-counting An examination of the passenger arrival process in building, including the Poisson arrival process and probability density function, and passenger arrivals in batches A consideration of daily vertical passenger traffic profiles, including two-way traffic profiles and the effects of inter-floor traffic An exploration of people flow solutions, including stairs, escalators, and elevators with collective and destination group control systems, as well as double-deck and multicar system People flow calculation and simulation models Elevator planning with ISO simulation method Elevator planning and evacuation of tall buildings Perfect for software designers in the private sector and academia,
will also earn a place in the libraries of elevator consultants, manufacturers, and architects who seek a one-stop reference for transportation devices from a functional and design perspective, as opposed to a hardware perspective.
People Flow in Buildings — читать онлайн ознакомительный отрывок
Ниже представлен текст книги, разбитый по страницам. Система сохранения места последней прочитанной страницы, позволяет с удобством читать онлайн бесплатно книгу «People Flow in Buildings», без необходимости каждый раз заново искать на чём Вы остановились. Поставьте закладку, и сможете в любой момент перейти на страницу, на которой закончили чтение.
Интервал:
Закладка:
Alexandris (1977) suggested that passenger arrivals in buildings follow Poisson process, i.e. passengers are assumed to arrive randomly in the elevator lobbies. The observations of Kuusinen in an office building revealed that people arrive randomly in up‐peak situation in offices but not during lunch time (Kuusinen 2008), when people tend to move in social groups, here called batches. This study was extended to cover different types of buildings. The smallest batch size is naturally one person. The observed batch sizes were the smallest in offices, and the biggest in resort hotels where the average batch size during the day was nearly two persons. The conclusion was that the arrivals of batches follow a Poisson process and thus the passenger arrivals can be modelled by a compound Poisson process. This is important to understand when generating realistic passenger traffic for simulations. In batches, usually one person only gives an elevator call, which makes a difference especially in destination control where all passengers are assumed to give a call.
3.2 Poisson Arrival Process
3.2.1 Probability Density Function
Random events, such as the number of phone calls per hour received by a call centre follow Poisson distribution. If the traffic peak period is divided into intervals of length t , the expected number of passenger arrivals within time t is N ( t ) = λt , where λ is the passenger arrival rate. For the Poisson distribution, the probability density function for N ( t ) arrivals within time t is
(3.1) 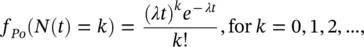
The mean and the variance σ 2of Poisson distribution are λt . Poisson arrival process is illustrated in Figure 3.2. Passenger arrivals follow Poisson process, when they are independent and memoryless, i.e. when the number of arrivals within an interval does not affect the probability of arrivals during later intervals. In a homogeneous Poisson process, arrival rate, λ , is constant for intervals of different lengths.
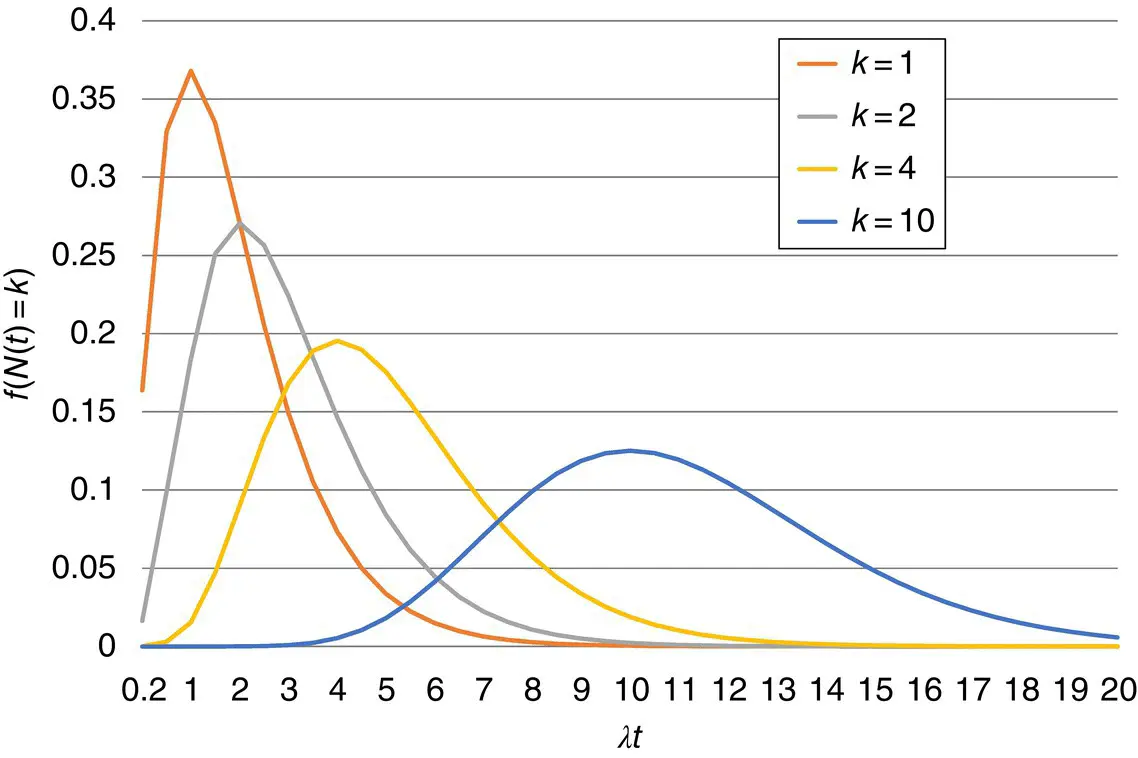
Figure 3.2 Probability density function for Poisson arrival process.
Table 3.2 X 2‐test results for passengers exiting through the security gates, office in Warsaw.
| Time of day | Arrival interval (s) | X 2 | Degrees of freedom | X 2 0.95 | X 2 0.05 | Suitably of H 0‐hypothesis |
|---|---|---|---|---|---|---|
| Daily 7:00–19:00 | 10 | 4818 | 7 | 2.2 | 14.1 | Poor |
| 30 | 7265 | 11 | 4.6 | 19.7 | Poor | |
| 60 | 1872 | 14 | 6.6 | 23.7 | Poor | |
| 300 | 911 | 15 | 7.3 | 25.0 | Poor | |
| 8:00–9:00 | 10 | 12.6 | 3 | 0.4 | 7.8 | Poor |
| 30 | 6.9 | 4 | 0.7 | 9.5 | Good | |
| 60 | 3.7 | 4 | 0.7 | 9.5 | Good | |
| 300 | 7.6 | 10 | 3.9 | 18.3 | Good | |
| 17:00–18:00 | 10 | 579 | 10 | 3.9 | 18.3 | Poor |
| 30 | 614 | 15 | 7.3 | 25.0 | Poor | |
| 60 | 6.3 | 14 | 6.6 | 23.7 | Fair | |
| 300 | 107 | 15 | 7.3 | 25.0 | Poor |
Alexandris (1977) performed manual counting of passenger arrivals in three office building lobbies in morning up‐peak situations, and reported the results in his doctoral thesis. Passenger arrivals were observed in a 10‐second resolution for a one‐hour period in each building. He analysed the data in different intervals, in Figure 3.3in a 30‐second interval, and made an assumption that passengers arrive randomly following a Poisson process. In a Poisson counting process, the time differences between passenger arrivals, i.e. inter‐arrival times, are exponentially distributed. To validate the assumption of Poisson distributed arrivals, Alexandris made a Chi‐square test for the measured data. The conclusion of the study was that passenger arrivals in elevator lobbies during morning up‐peak period can be accepted to follow a Poisson process, or at least this assumption cannot be rejected. Currently, the assumption of Poisson arrival theory is widely applied in modelling people flow in buildings. According to the Poisson process, passengers arrive randomly in elevator lobbies with a defined arrival rate.
Figure 3.3 Number of occurrences as a function of number passengers analysed in 30‐second intervals for a one‐hour period
( Source: Alexandris (1977). © John Wiley & Sons).
3.2.2 Example of Passenger Arrivals Through Security Cages
Passenger transfers through security gates in an elevator lobby is analysed to find out if the passenger arrivals follow Poisson process. Security gates provide an accurate passenger counting method in and out from an office building. With the registered security gate data, passengers are detected automatically and there is no place for human errors in passenger counting.
Figure 3.4shows an example of the originally recorded data for a 10‐minute period from the morning up‐peak with a one‐second resolution and another from the evening down‐peak. One can notice in the morning at most two persons have arrived during the same second, while in the evening down‐peak situation even three persons have departed simultaneously from the elevator lobby through different turnstiles.
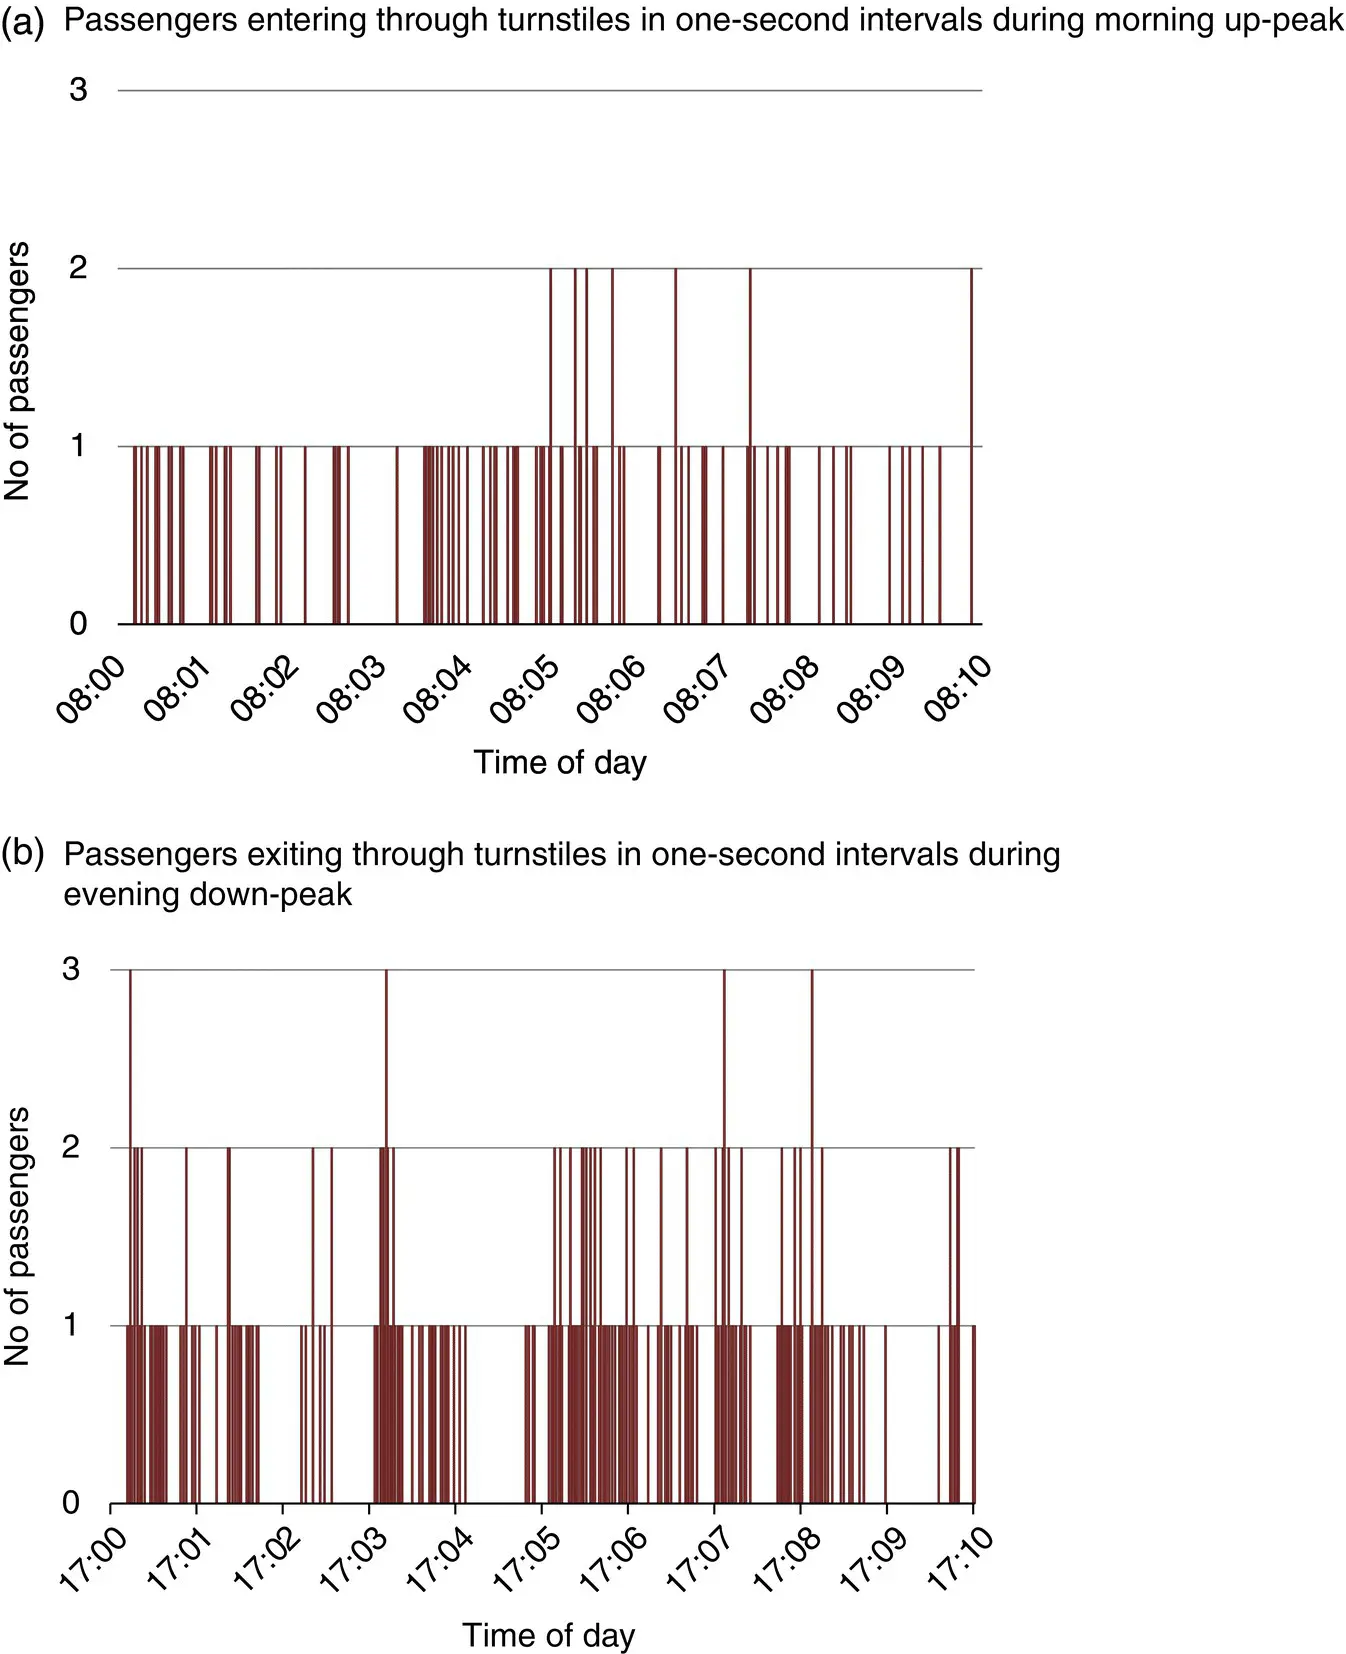
Figure 3.4 Passengers entering (a) and exiting (b) through turnstiles for a 10‐minute peak traffic period.
The combined inter‐arrival times of the sequential passenger arrivals and departures through the security gates are shown in Figure 3.5. The mean inter‐arrival time is 6.5 seconds for the entering passengers during the first 10 minutes in the morning up‐peak ( Figure 3.4a), and 2.5 seconds for the exiting passengers during the evening down‐peak ( Figure 3.4b). The mean inter‐arrival time is 4.6 seconds during the busy hours between 8:00 and 18:00 o'clock. Since the elevator lobby entrance has five turnstiles, for one turnstile the mean inter‐arrival time is 23 seconds on average. The first the person shows the access card and then waits for the gates to open before walking through the turnstile. It takes about three to five seconds for one person to move through a security gate. Since the average inter‐arrival time is over 20 seconds, there will be queuing only at peak traffic periods. During the evening down‐peak traffic, the passenger arrival rate is 24 persons per minute and random crowding in front of the turnstiles may appear.
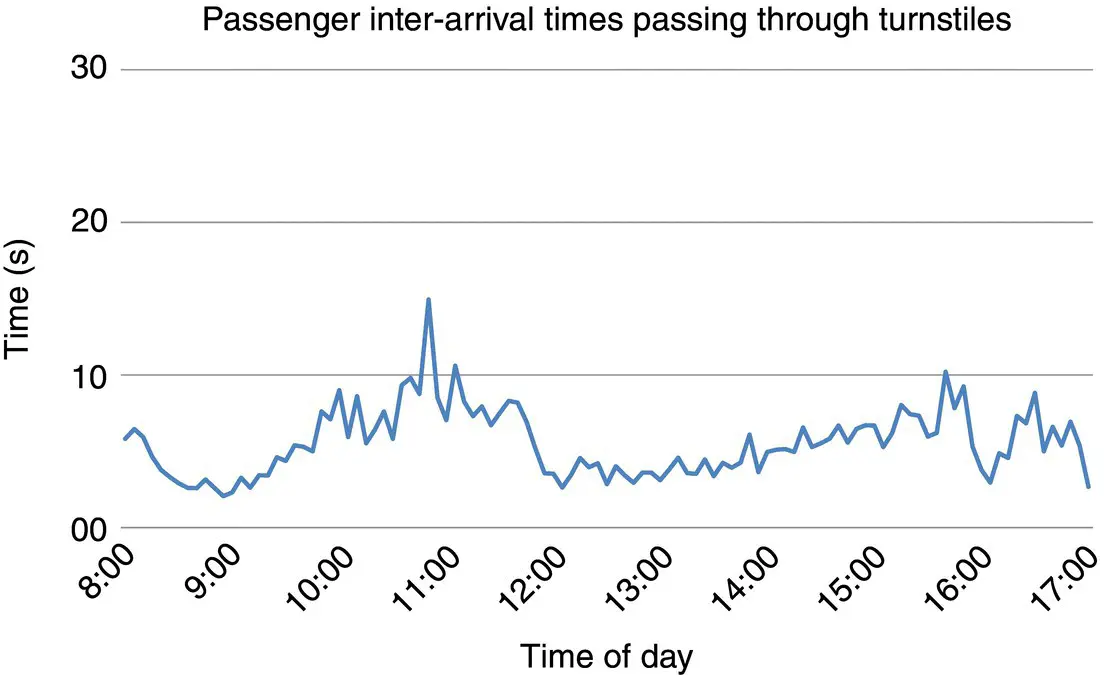
Figure 3.5 Combined inter‐arrival times of entering and exiting people through security gates.
Читать дальшеИнтервал:
Закладка:
Похожие книги на «People Flow in Buildings»
Представляем Вашему вниманию похожие книги на «People Flow in Buildings» списком для выбора. Мы отобрали схожую по названию и смыслу литературу в надежде предоставить читателям больше вариантов отыскать новые, интересные, ещё непрочитанные произведения.


Обсуждение, отзывы о книге «People Flow in Buildings» и просто собственные мнения читателей. Оставьте ваши комментарии, напишите, что Вы думаете о произведении, его смысле или главных героях. Укажите что конкретно понравилось, а что нет, и почему Вы так считаете.