Maria Cristina Mariani - Data Science in Theory and Practice
Здесь есть возможность читать онлайн «Maria Cristina Mariani - Data Science in Theory and Practice» — ознакомительный отрывок электронной книги совершенно бесплатно, а после прочтения отрывка купить полную версию. В некоторых случаях можно слушать аудио, скачать через торрент в формате fb2 и присутствует краткое содержание. Жанр: unrecognised, на английском языке. Описание произведения, (предисловие) а так же отзывы посетителей доступны на портале библиотеки ЛибКат.
- Название:Data Science in Theory and Practice
- Автор:
- Жанр:
- Год:неизвестен
- ISBN:нет данных
- Рейтинг книги:3 / 5. Голосов: 1
-
Избранное:Добавить в избранное
- Отзывы:
-
Ваша оценка:
Data Science in Theory and Practice: краткое содержание, описание и аннотация
Предлагаем к чтению аннотацию, описание, краткое содержание или предисловие (зависит от того, что написал сам автор книги «Data Science in Theory and Practice»). Если вы не нашли необходимую информацию о книге — напишите в комментариях, мы постараемся отыскать её.
will also earn a place in the libraries of practicing data scientists, data and business analysts, and statisticians in the private sector, government, and academia.
Data Science in Theory and Practice — читать онлайн ознакомительный отрывок
Ниже представлен текст книги, разбитый по страницам. Система сохранения места последней прочитанной страницы, позволяет с удобством читать онлайн бесплатно книгу «Data Science in Theory and Practice», без необходимости каждый раз заново искать на чём Вы остановились. Поставьте закладку, и сможете в любой момент перейти на страницу, на которой закончили чтение.
Интервал:
Закладка:
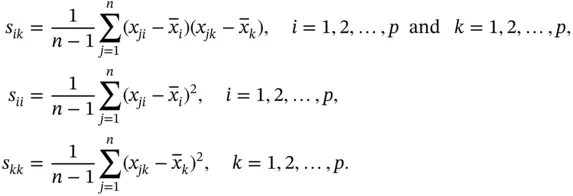
where
Substituting  and
and  into ( 3.6) and canceling terms, we obtain
(3.7) 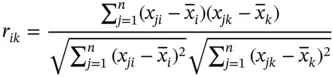
for  and
and  . We note that the sample correlation is symmetric since
  for all
  and
and  .
.
The sample correlation coefficient is a measure of the linear association between two variables and does not depend on the units of measurement, i.e. when you construct the sample correlation coefficient, the units of measurement that are used cancel out. The sample correlation matrixis analogous to the covariance matrix with correlations in place of covariances:
(3.8) 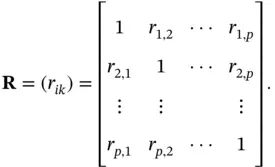
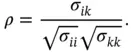
The population correlation matrixsimilar to ( 3.8) is defined as follows:
(3.9) 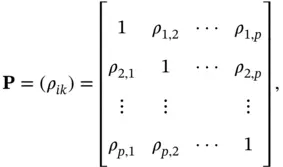
where
We note that even though the signs of the sample correlation and the sample covariance are the same, the correlation is easier to interpret because its magnitude is bounded. It is bounded within the closed interval  . To summarize, the sample correlation
  has the following properties:
1 The value of the sample correlation must lie between and inclusive. indicates perfect linear relationship and indicates perfect inverse relationship.
2 The sample correlation measures the strength of the linear association between two variables. If equals to zero, it implies no linear association between the components. Otherwise, the sign of indicates the direction of the association. If is positive, it means that as one variable gets larger the other gets larger. If is negative, it means that as one gets larger, the other gets smaller (often called an “inverse” correlation). A larger value of implies greater linear strength. This is an indication that both variables move in the opposite direction if one variable increases, the other variable decreases with the same magnitude (and vice versa).
Example 3.4Consider the following data matrix introduced in Example 3.1:
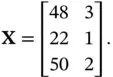
Each receipt yields a pair of measurements, total dollar sales, and number of movies sold. We find the sample correlation  as follows:
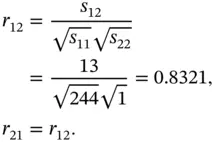
Therefore,
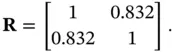
In this example, we observe the variables  and
and  are highly positively correlated since
  . This implies that if dollar sales (
  ) increases, the number of movies sold (
  ) also increases.
3.6 Linear Combinations of Variables
Most often, we are interested in linear combinations of the variables  . In this section, we investigate the means, variances, and covariances of linear combinations.
Let  be constants and consider the linear combination of the elements of the vector
  ,
,
(3.10) 
where  . If the same coefficient vector
  is applied to each
  in a sample, we have
(3.11) 
For example, if  , we have
Интервал:
Закладка:
Похожие книги на «Data Science in Theory and Practice»
Представляем Вашему вниманию похожие книги на «Data Science in Theory and Practice» списком для выбора. Мы отобрали схожую по названию и смыслу литературу в надежде предоставить читателям больше вариантов отыскать новые, интересные, ещё непрочитанные произведения.

![Роман Зыков - Роман с Data Science. Как монетизировать большие данные [litres]](/books/438007/roman-zykov-roman-s-data-science-kak-monetizirova-thumb.webp)


Обсуждение, отзывы о книге «Data Science in Theory and Practice» и просто собственные мнения читателей. Оставьте ваши комментарии, напишите, что Вы думаете о произведении, его смысле или главных героях. Укажите что конкретно понравилось, а что нет, и почему Вы так считаете.