Urban Remote Sensing
Здесь есть возможность читать онлайн «Urban Remote Sensing» — ознакомительный отрывок электронной книги совершенно бесплатно, а после прочтения отрывка купить полную версию. В некоторых случаях можно слушать аудио, скачать через торрент в формате fb2 и присутствует краткое содержание. Жанр: unrecognised, на английском языке. Описание произведения, (предисловие) а так же отзывы посетителей доступны на портале библиотеки ЛибКат.
- Название:Urban Remote Sensing
- Автор:
- Жанр:
- Год:неизвестен
- ISBN:нет данных
- Рейтинг книги:4 / 5. Голосов: 1
-
Избранное:Добавить в избранное
- Отзывы:
-
Ваша оценка:
Urban Remote Sensing: краткое содержание, описание и аннотация
Предлагаем к чтению аннотацию, описание, краткое содержание или предисловие (зависит от того, что написал сам автор книги «Urban Remote Sensing»). Если вы не нашли необходимую информацию о книге — напишите в комментариях, мы постараемся отыскать её.
is a state-of-the-art review of the latest progress in the subject. The text examines how evolving innovations in remote sensing allow to deliver the critical information on cities in a timely and cost-effective way to support various urban management activities and the scientific research on urban morphology, socio-environmental dynamics, and sustainability.
Chapters are written by leading scholars from a variety of disciplines including remote sensing, GIS, geography, urban planning, environmental science, and sustainability science, with case studies predominately drawn from North America and Europe.
A review of the essential and emerging research areas in urban remote sensing including sensors, techniques, and applications, especially some critical issues that are shifting the directions in urban remote sensing research. Illustrated in full color throughout, including numerous relevant case studies and extensive discussions of important concepts and cutting-edge technologies to enable clearer understanding for non-technical audiences.
will be of particular interest to upper-division undergraduate and graduate students, researchers and professionals working in the fields of remote sensing, geospatial information, and urban & environmental planning.
Urban Remote Sensing — читать онлайн ознакомительный отрывок
Ниже представлен текст книги, разбитый по страницам. Система сохранения места последней прочитанной страницы, позволяет с удобством читать онлайн бесплатно книгу «Urban Remote Sensing», без необходимости каждый раз заново искать на чём Вы остановились. Поставьте закладку, и сможете в любой момент перейти на страницу, на которой закончили чтение.
Интервал:
Закладка:
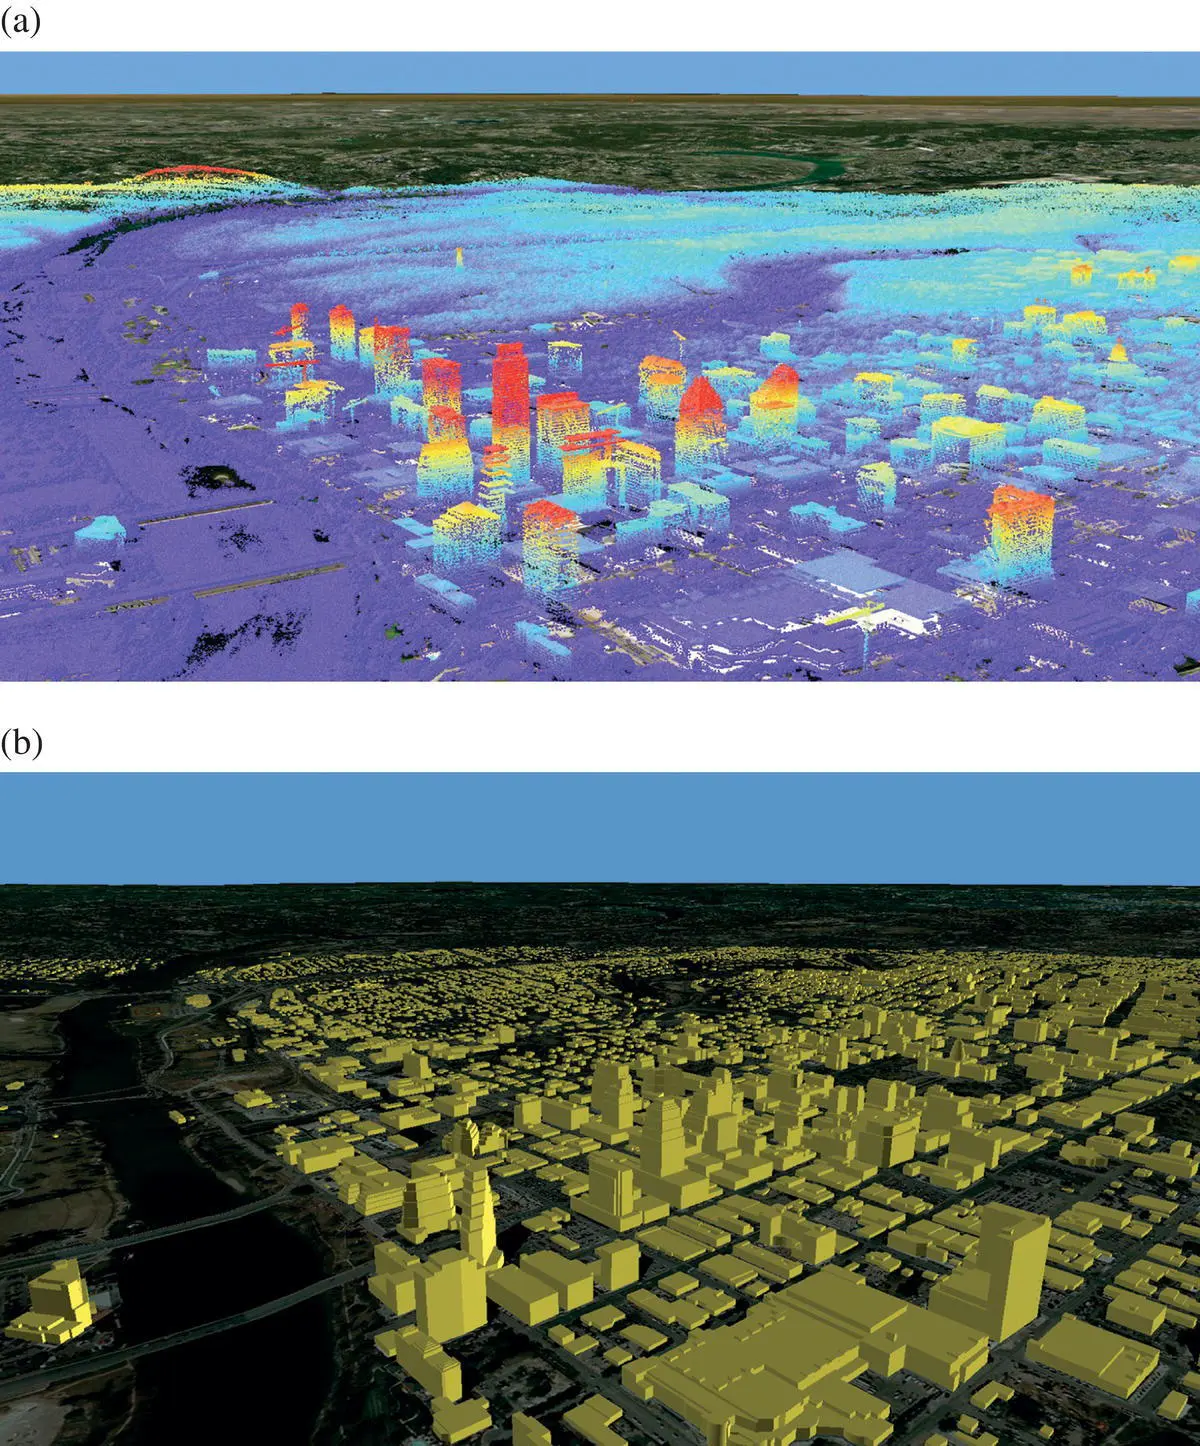
FIGURE 2.2 3D lidar‐derived visualizations of downtown Austin, Texas looking northwest using raw point cloud data from 2015 (a), and extruded building footprints from 2006 (b).
Point cloud filtering is a process whereby all individual points within the point cloud are assigned to a class to better differentiate the point data (Shan and Toth 2018). The basic approach assigns points to either ground or nonground classes using a filtering algorithm based on trends in point heights (Axelsson 1999). Return number for individual points can also be utilized to aid this filtering effort. LAS file specifications allow points to be assigned to many other classes (e.g. high vegetation, building, low point noise, etc.) through more nuanced algorithms and/or manual efforts. Once filtered and assigned class designations, points can be analyzed directly as discussed above (upper‐right of Figure 2.3) or further processed to create raster Digital Elevation Models (DEMs).
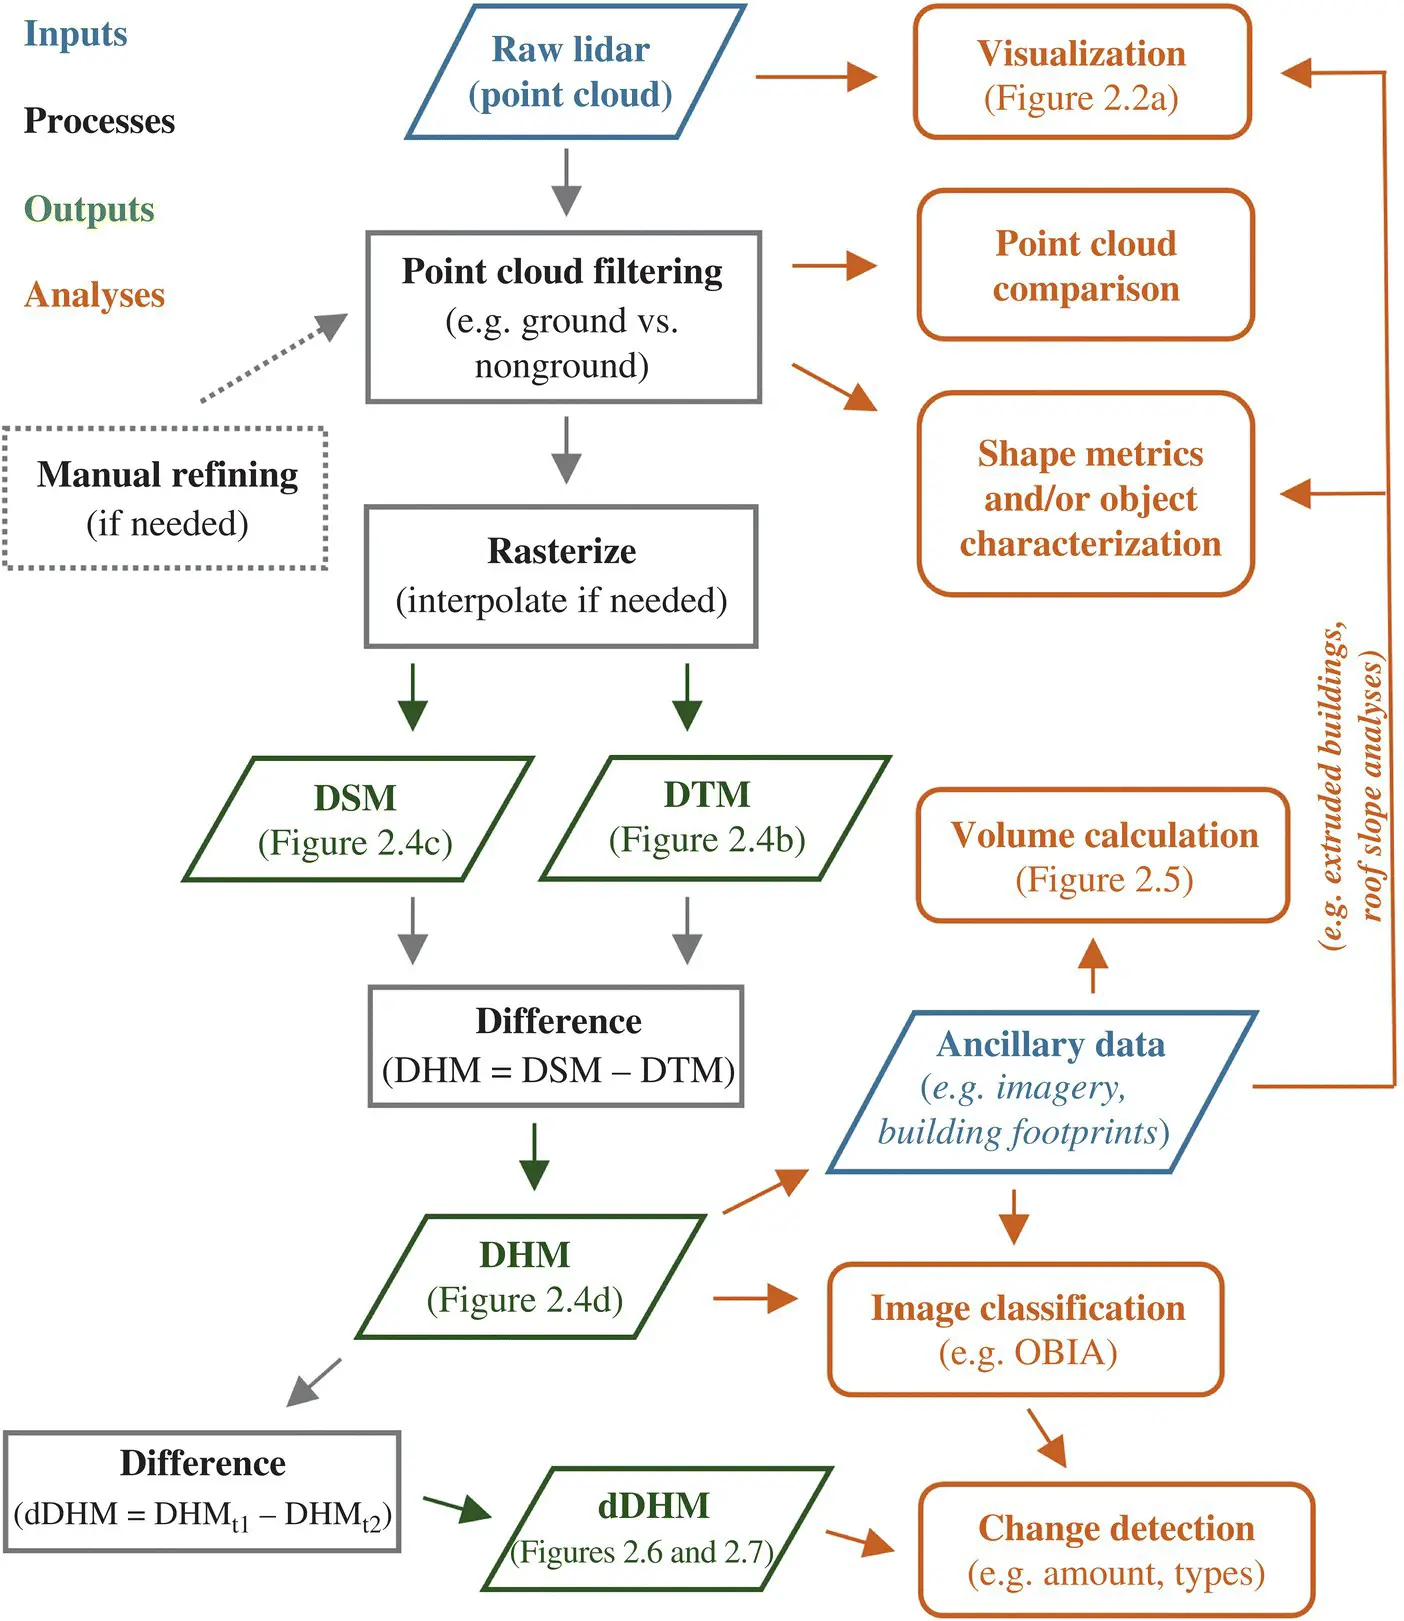
FIGURE 2.3 Lidar data processing workflows, data products, and analysis approaches for urban remote sensing. For the purpose of this figure, DSM, Digital Surface Model.
Lidar‐derived raster surfaces, referred to generally as DEMs, provide a more approachable way in which to utilize lidar data. Note that DEMs are created with other elevation data and are not lidar‐specific datasets. Specific types of DEMs include the following:
Digital Terrain Model (DTM): a raster representing the bare Earth surface. Absolute elevation values from mean sea level are stored in pixels.
Digital Surface Model (DSM): a raster representing the bare Earth surface as well as all surface features such as buildings, tree canopies, etc. Absolute elevation values from mean sea level are stored in pixels. For this chapter, we elect not to use the DSM acronym for this dataset because it conflicts with another acronym we use in upcoming sections.
Digital Height Model (DHM): a raster surface containing all features like the DSM but with relative elevation values from ground‐level stored in pixels. DHMs are also referred to as Normalized Digital Surface Models (nDSMs).
DTMs are generated using heights of ground‐classified points (which may or may not require spatial interpolation to fill data gaps depending on point density and types of features within the area) while DSMs utilize heights of all points (ground and nonground) to create the raster surface. The DHM is calculated by subtracting the DTM from the DSM (see Eq. (2.1)):
(2.1) 
Figure 2.4provides examples of each of these datasets at a 1 m spatial resolution for Detroit, Michigan. The DSM ( Figure 2.4b) and DHM ( Figure 2.4d) appear similar because they both contain surfaces features but a difference can be spotted between the two as you move inland (to the north) where the DHM low lying areas (i.e. streets, residential yards) appear black and not gray. The DTM is a smoother surface representing the bare Earth without the surface features ( Figure 2.4c), and in this case includes artifacts such as highway overpasses and bridges attesting to the complexity of point cloud filtering.
As for built‐up analyses using lidar‐derived raster data (refer back to Figure 2.3), the DHM provides the ideal dataset because it is normalized and conveys building height data from ground level. Pixel values for buildings, therefore, are representative and useful. Using building footprints (vector polygons), individual building heights can be extracted and extruded to visualize only the built‐up environment as solid objects (see Figure 2.2). Building footprints are highly useful ancillary data for urban analyses and are often freely available through local cadastral mapping sources or can be generated using the DHM (and other data such as aerial imagery) through Object‐Based Image Analysis (OBIA). OBIA segmentation provides a semi‐automatic procedure to create vector polygons of ground features. In the urban environment, especially where buildings are quite tall and protrude from the surrounding landscape features, OBIA segmentation is effective (Teo and Shih 2013). Imagery‐lidar fusion (i.e. adding the DHM data as an additional band within an image stack) improves the accuracy of OBIA classification results within urban areas compared to imagery alone (Ellis and Mathews 2019). Lidar intensity information is also useful as an additional band for further differentiation of surface features in OBIA analyses.
Building footprint data are also helpful in the calculation of built‐up volume. As Figure 2.5illustrates, the input point cloud data (a) are used to create a DHM raster that is further altered by extracting only pixels within building footprint extents – notice the tree canopies along the streets (b) are no longer visible within the clipped DHM (c). Importantly, this removes all nonbuilt‐up pixels from the analysis for accurate volume estimation. At this stage, volume calculation is conducted at a per‐pixel or per‐building scale (refer to Figure 2.3). In the example provided in Figure 2.5, the height values are in meters and the spatial resolution is 1 m making the per‐pixel volume the same as the height value (though in m 3). The per‐building alternative would sum the values of all pixel centroids falling within individual building footprint extents (e.g. zonal statistics in a GIS) and spatially join the per‐building sum value to the building footprint polygons as an attribute.
Multi‐temporal lidar data analysis facilitates the quantification of built‐up change within urban areas (Vu et al. 2004; Ellis and Mathews 2019) including characterization of types of changes occurring (Teo and Shih 2013; Dong et al. 2018). Although many change detection options exist (too many to cover here), direct differencing of the multi‐temporal DHMs is a common approach. The difference of DHMs (or differential DHM), simply dDHM, is calculated by Eq. (2.2)where t 1 indicates the first lidar data acquisition (time 1) and t 2 represents the second (time 2):
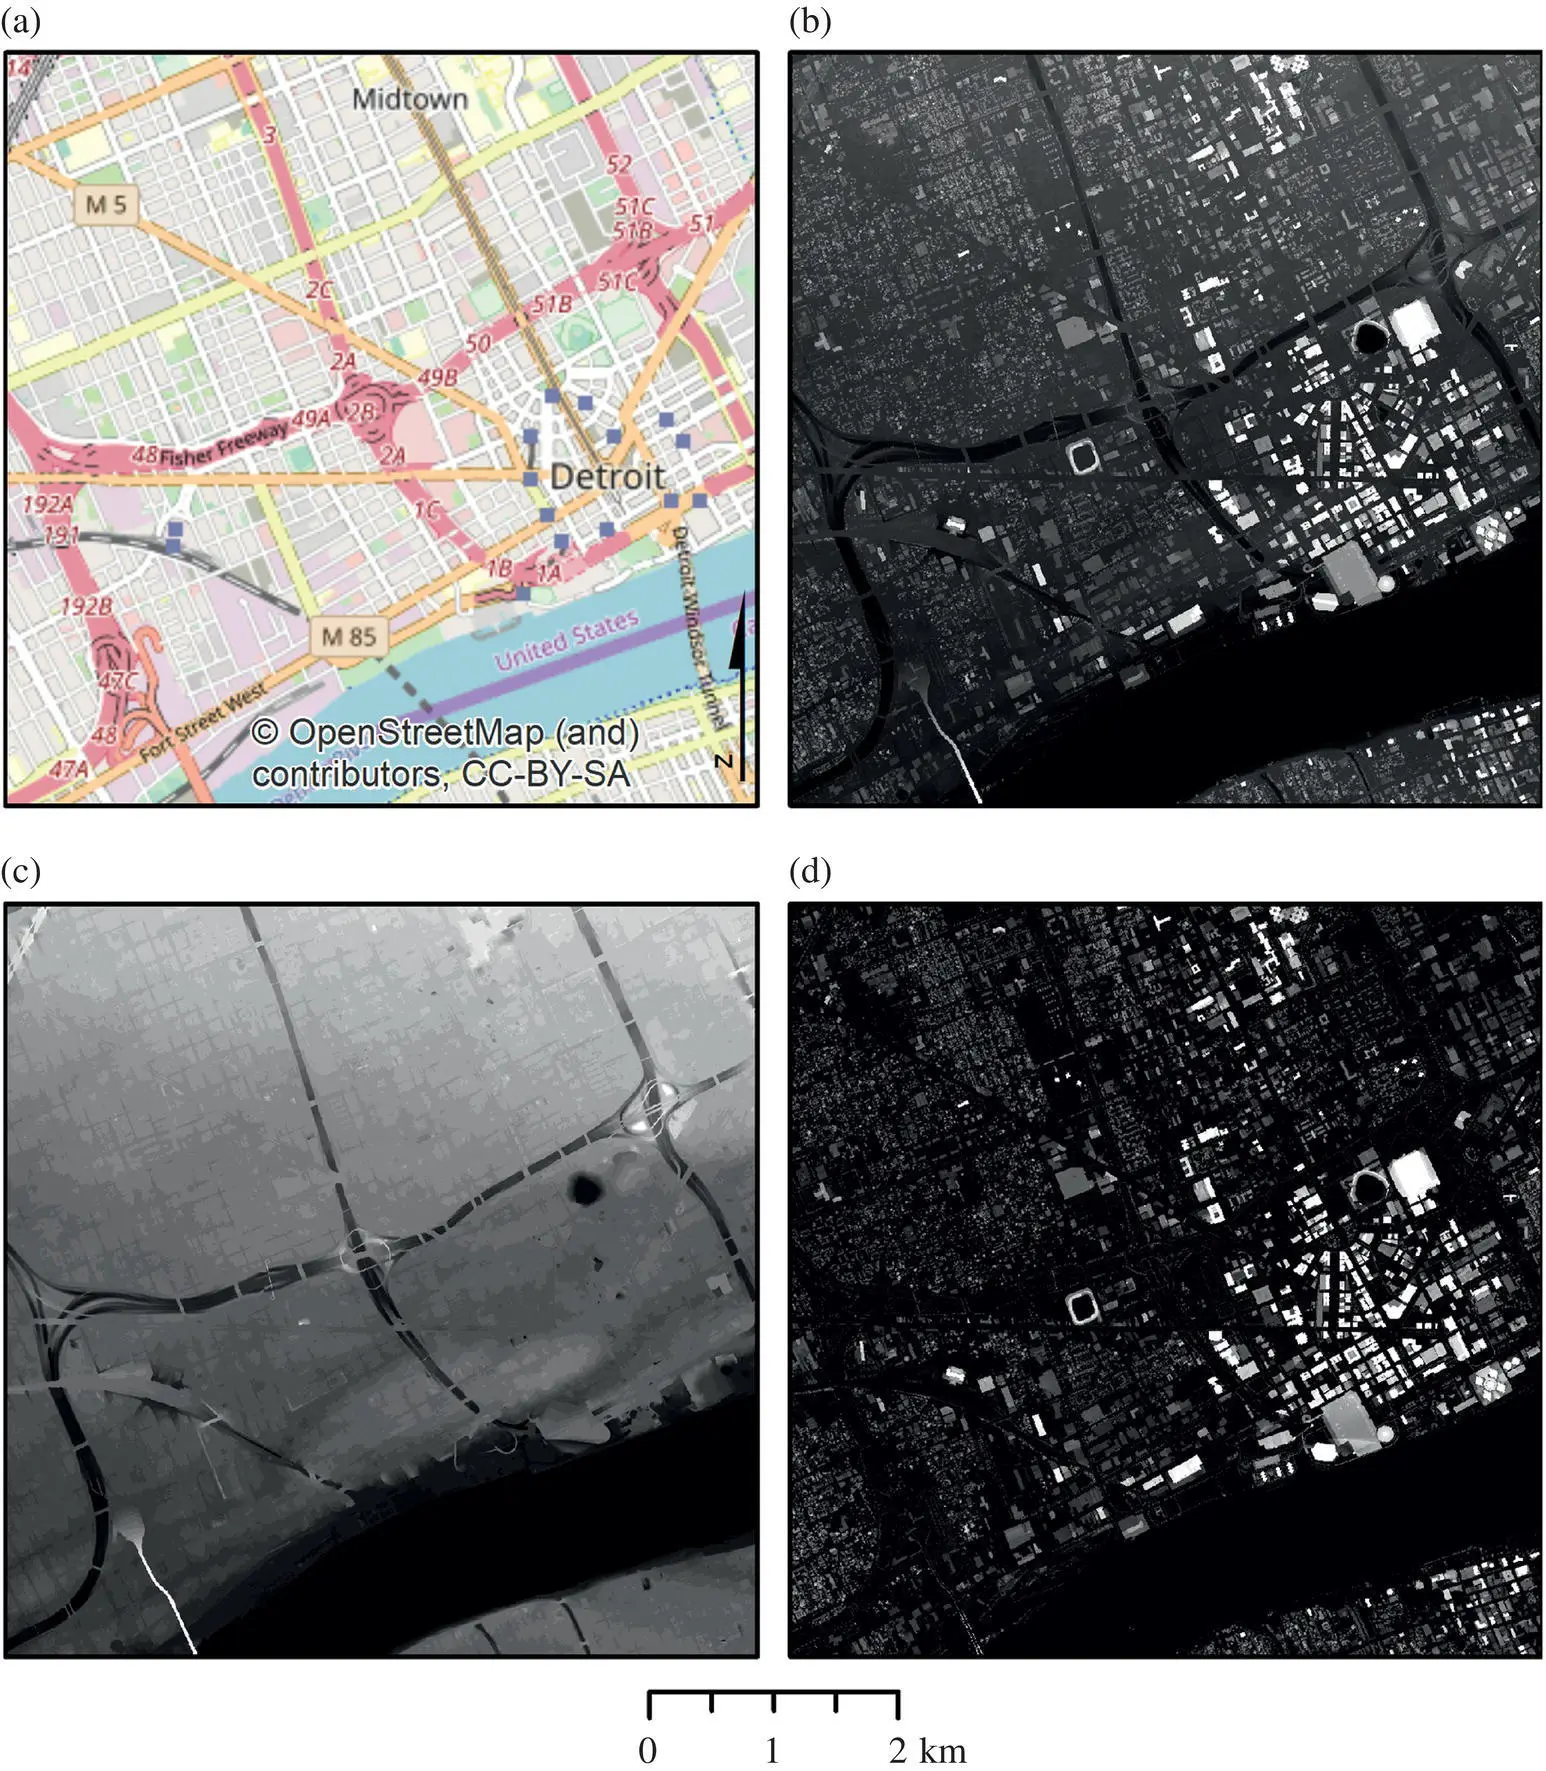
FIGURE 2.4 Lidar‐derived rasters (1 m spatial resolution) for Detroit, Michigan, 2004: (a) reference map.
Source : OpenStreetMap.
(b) Digital Terrain Model (DTM), (c) Digital Surface Model, and (d) Digital Height Model (DHM).
(2.2) 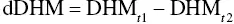
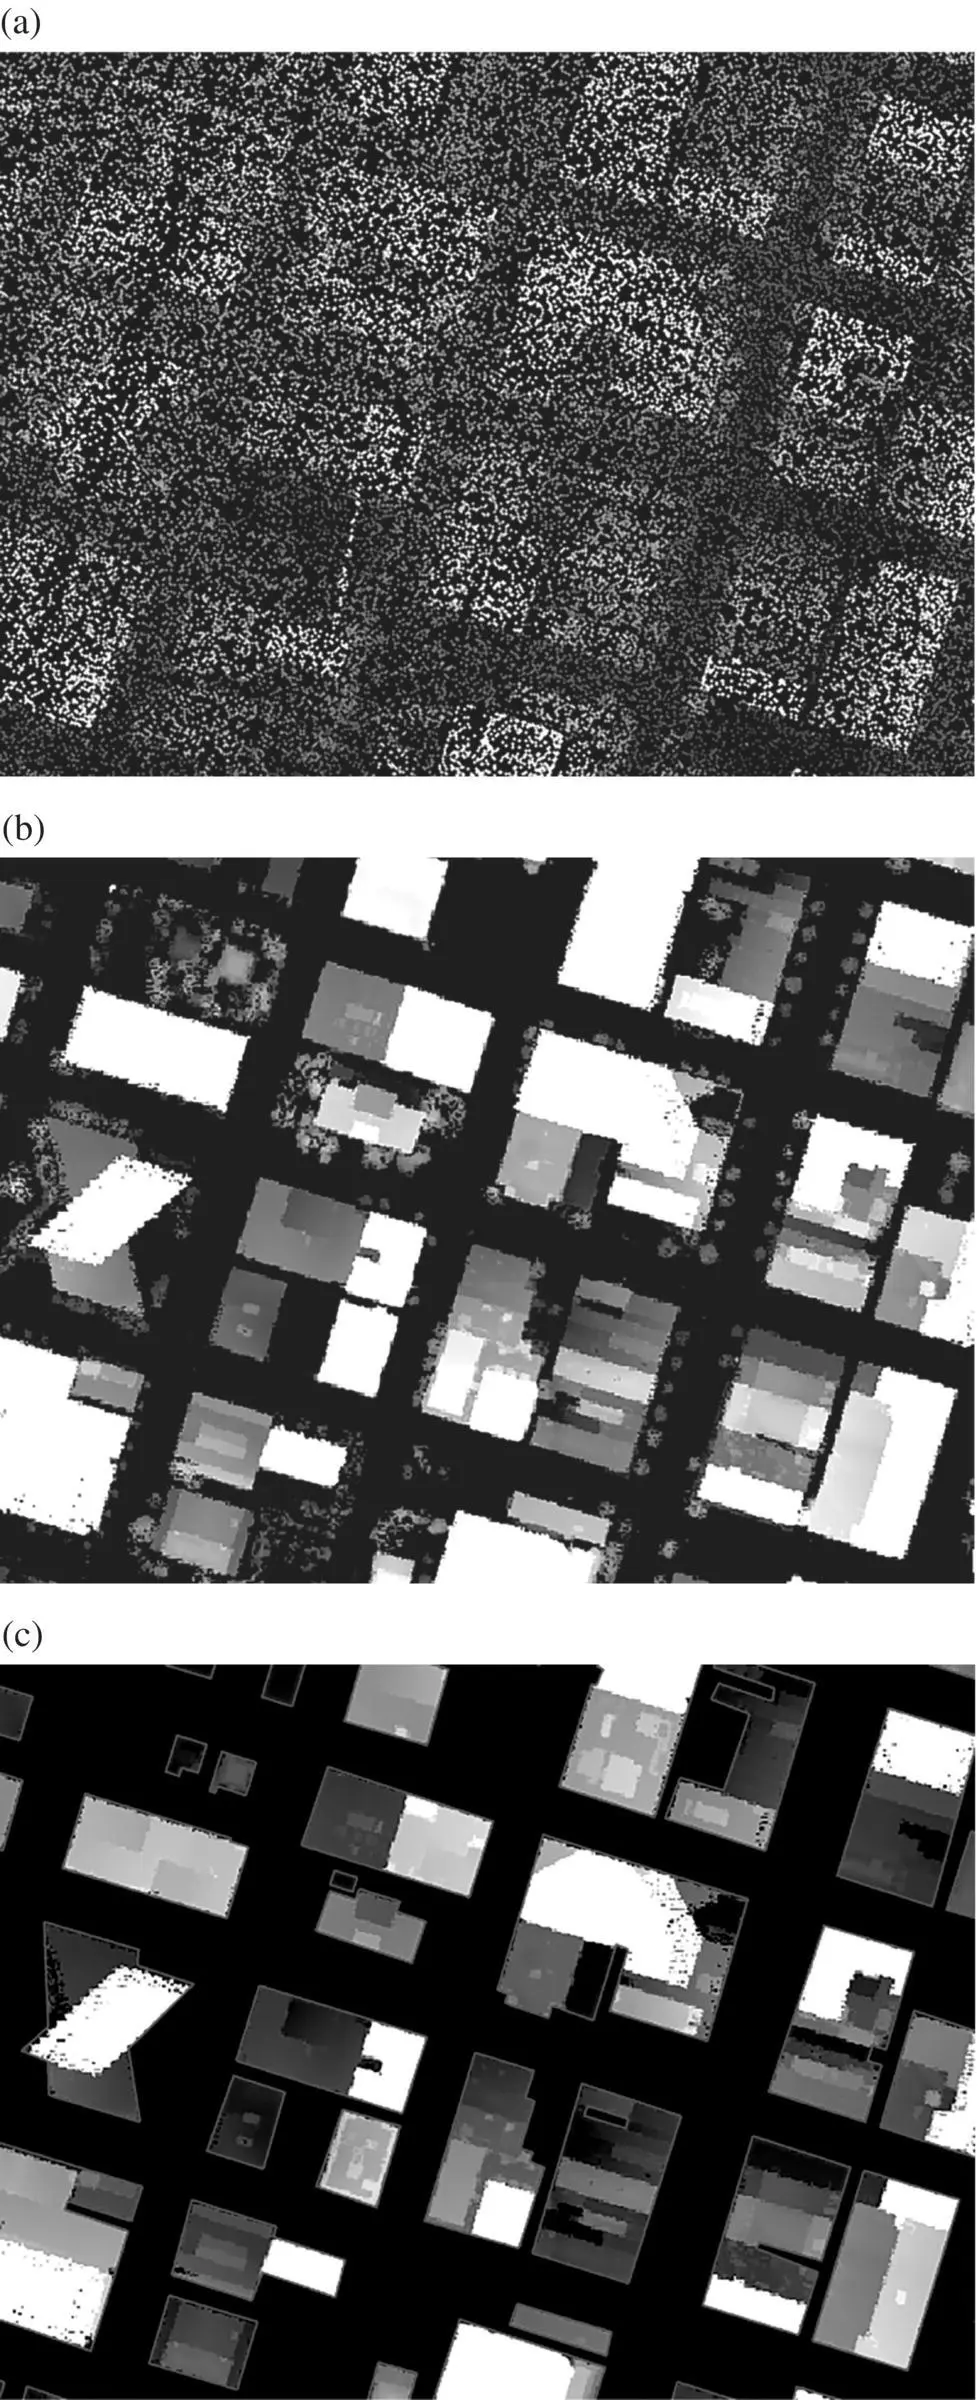
FIGURE 2.5 Lidar workflow to obtain building‐only volume: raw point cloud data (a), lidar‐derived DHM raster (b), DHM clipped by red building footprints (c); white represents high buildings, black signifies low/ground. The clipped dataset (c) is used for urban built‐up volume (m 3summed per 1 m pixel).
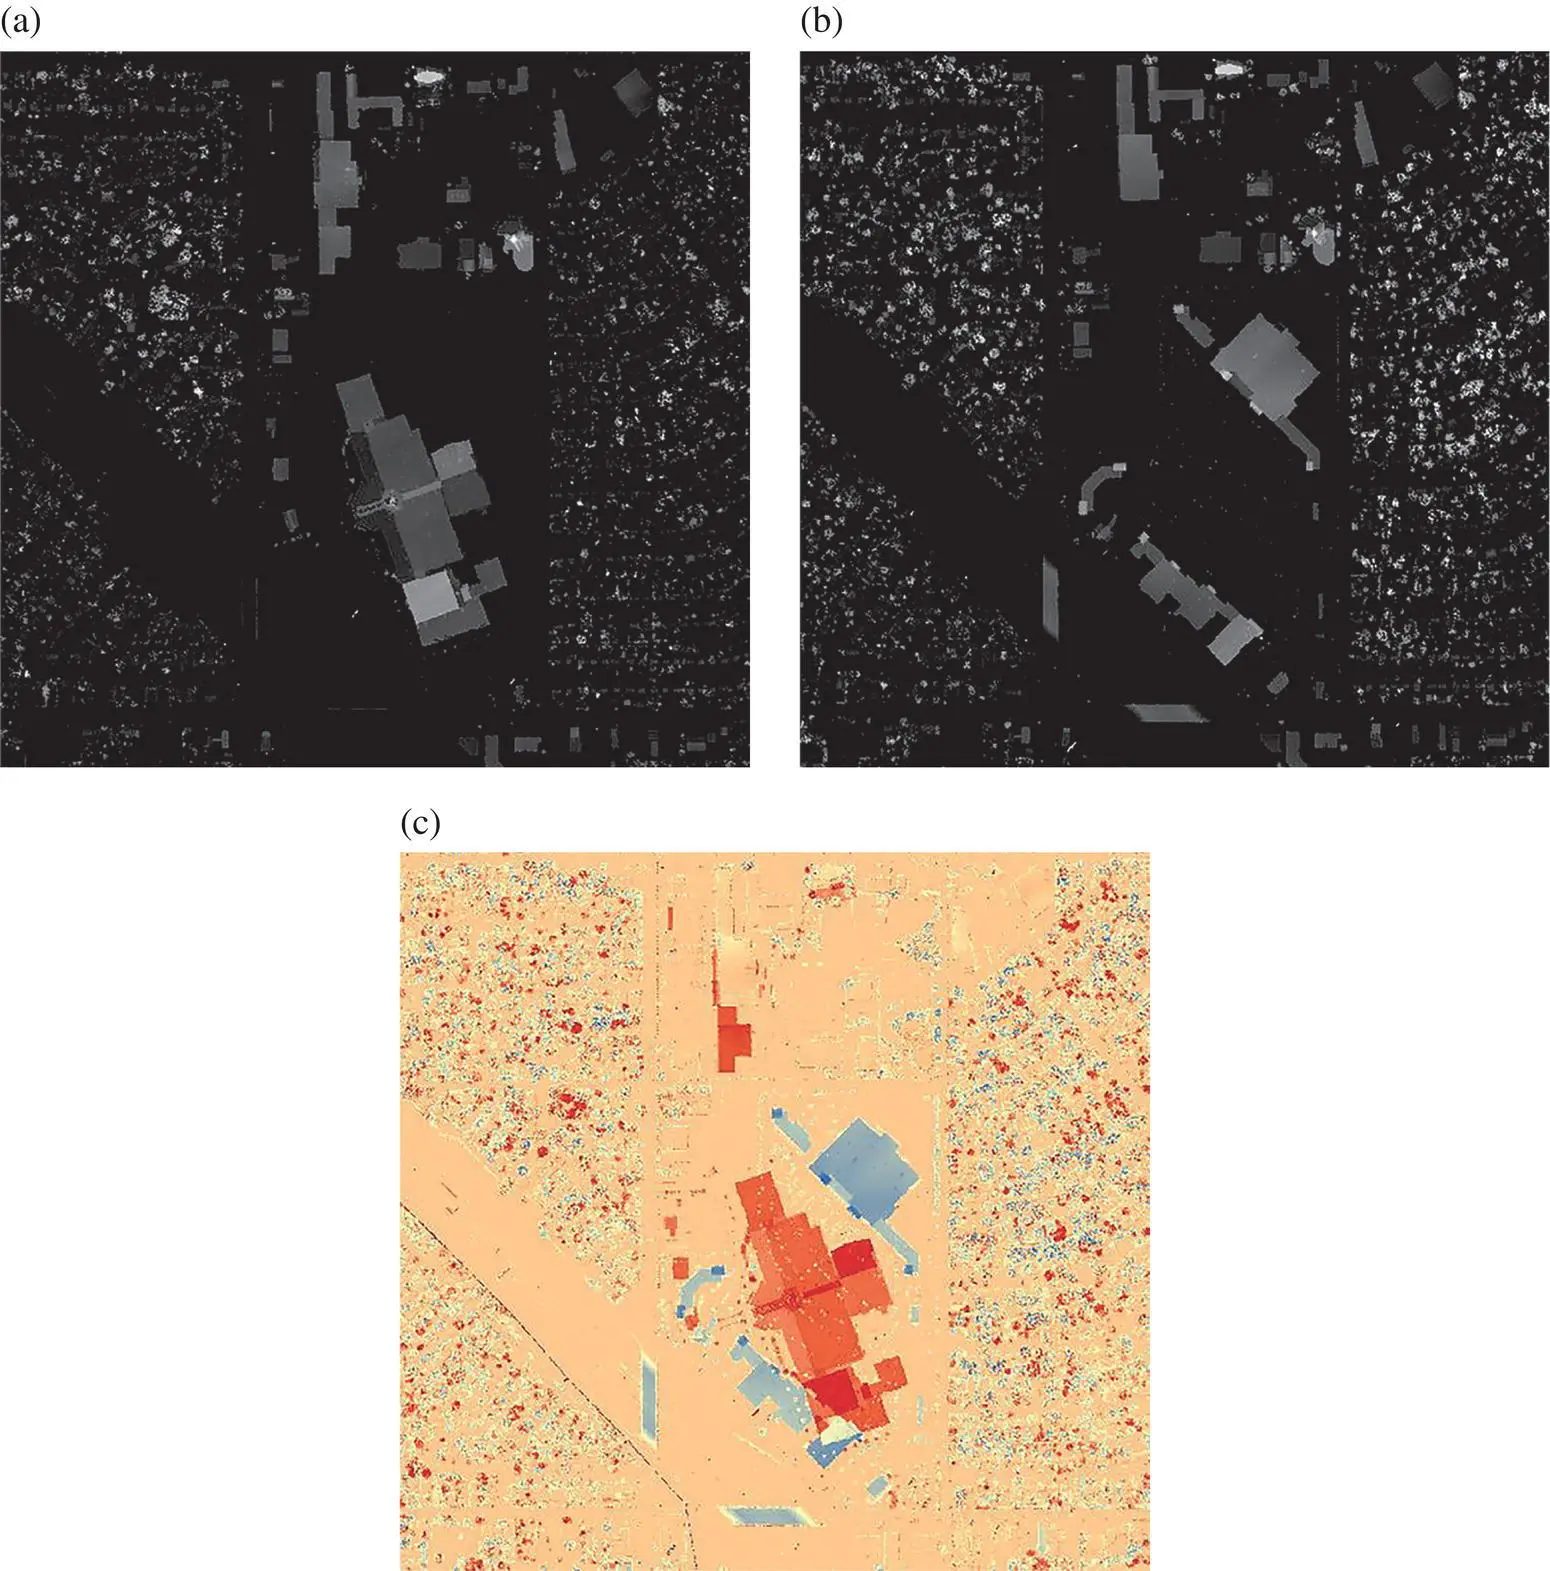
FIGURE 2.6 An example of built‐up change in southeast San Antonio, Texas: 2003 DHM (a), 2012 DHM (b), and difference of DHM (dDHM) (c). For the DHMs (a, b), pixels with higher values are shown with white (i.e. tall buildings) whereas lower values are black (i.e. ground). For the dDHM, red color indicates decreases in height (e.g. demolished buildings, removed trees) between the two years whereas blue denotes increases in height (e.g. new buildings, new or larger tree canopies).
Читать дальшеИнтервал:
Закладка:
Похожие книги на «Urban Remote Sensing»
Представляем Вашему вниманию похожие книги на «Urban Remote Sensing» списком для выбора. Мы отобрали схожую по названию и смыслу литературу в надежде предоставить читателям больше вариантов отыскать новые, интересные, ещё непрочитанные произведения.


Обсуждение, отзывы о книге «Urban Remote Sensing» и просто собственные мнения читателей. Оставьте ваши комментарии, напишите, что Вы думаете о произведении, его смысле или главных героях. Укажите что конкретно понравилось, а что нет, и почему Вы так считаете.