Urban Remote Sensing
Здесь есть возможность читать онлайн «Urban Remote Sensing» — ознакомительный отрывок электронной книги совершенно бесплатно, а после прочтения отрывка купить полную версию. В некоторых случаях можно слушать аудио, скачать через торрент в формате fb2 и присутствует краткое содержание. Жанр: unrecognised, на английском языке. Описание произведения, (предисловие) а так же отзывы посетителей доступны на портале библиотеки ЛибКат.
- Название:Urban Remote Sensing
- Автор:
- Жанр:
- Год:неизвестен
- ISBN:нет данных
- Рейтинг книги:4 / 5. Голосов: 1
-
Избранное:Добавить в избранное
- Отзывы:
-
Ваша оценка:
Urban Remote Sensing: краткое содержание, описание и аннотация
Предлагаем к чтению аннотацию, описание, краткое содержание или предисловие (зависит от того, что написал сам автор книги «Urban Remote Sensing»). Если вы не нашли необходимую информацию о книге — напишите в комментариях, мы постараемся отыскать её.
is a state-of-the-art review of the latest progress in the subject. The text examines how evolving innovations in remote sensing allow to deliver the critical information on cities in a timely and cost-effective way to support various urban management activities and the scientific research on urban morphology, socio-environmental dynamics, and sustainability.
Chapters are written by leading scholars from a variety of disciplines including remote sensing, GIS, geography, urban planning, environmental science, and sustainability science, with case studies predominately drawn from North America and Europe.
A review of the essential and emerging research areas in urban remote sensing including sensors, techniques, and applications, especially some critical issues that are shifting the directions in urban remote sensing research. Illustrated in full color throughout, including numerous relevant case studies and extensive discussions of important concepts and cutting-edge technologies to enable clearer understanding for non-technical audiences.
will be of particular interest to upper-division undergraduate and graduate students, researchers and professionals working in the fields of remote sensing, geospatial information, and urban & environmental planning.
Urban Remote Sensing — читать онлайн ознакомительный отрывок
Ниже представлен текст книги, разбитый по страницам. Система сохранения места последней прочитанной страницы, позволяет с удобством читать онлайн бесплатно книгу «Urban Remote Sensing», без необходимости каждый раз заново искать на чём Вы остановились. Поставьте закладку, и сможете в любой момент перейти на страницу, на которой закончили чтение.
Интервал:
Закладка:
Statistical results provided in Table 2.1indicate moderate, positive relationships between the DSM product and the aggregated lidar data following application of the spatial trend (i.e. DSM vs. lidar trend). Statistical results show weak correlations between raw comparisons (i.e. DSM vs. lidar) and strong, positive correlations between trend to trend comparisons (i.e. DSM trend vs. lidar trend). The highest correlation values (i.e. DSM trend vs. lidar trend) were observed for Austin, TX ( r 2= 0.98), Washington, DC ( r 2= 0.98), and San Antonio, TX ( r 2= 0.97; see Figure 2.11). Importantly, the direct, positive relationships are similarly predictive of built‐up volume in areas with low values (i.e. suburban, rural) as in areas with high values (i.e. downtown, industrial). As validated by building volume derived from lidar data with very limited availability in time and space, DSM can be applied for 3D monitoring of global urban areas (Nghiem et al. 2017; Mathews et al. 2019). Moreover, the linear relationship between DSM backscatter and 3D building volume holds true throughout the entire dynamic range of urban backscatter without a saturation effect (Mathews et al. 2019) either at the low limit (such as small wooden houses in residential areas) or the high end (such as steel skyscrapers in city centers). This implies that DSM can be used to estimate building volume density (i.e. the total build volume per pixel or per unit area) regardless of building size or type, or whether the total building volume consists of many small buildings or a few large buildings. Thereby, the DSM provides a simple approach applicable to various urban classes having different structural patterns without many confounding factors.
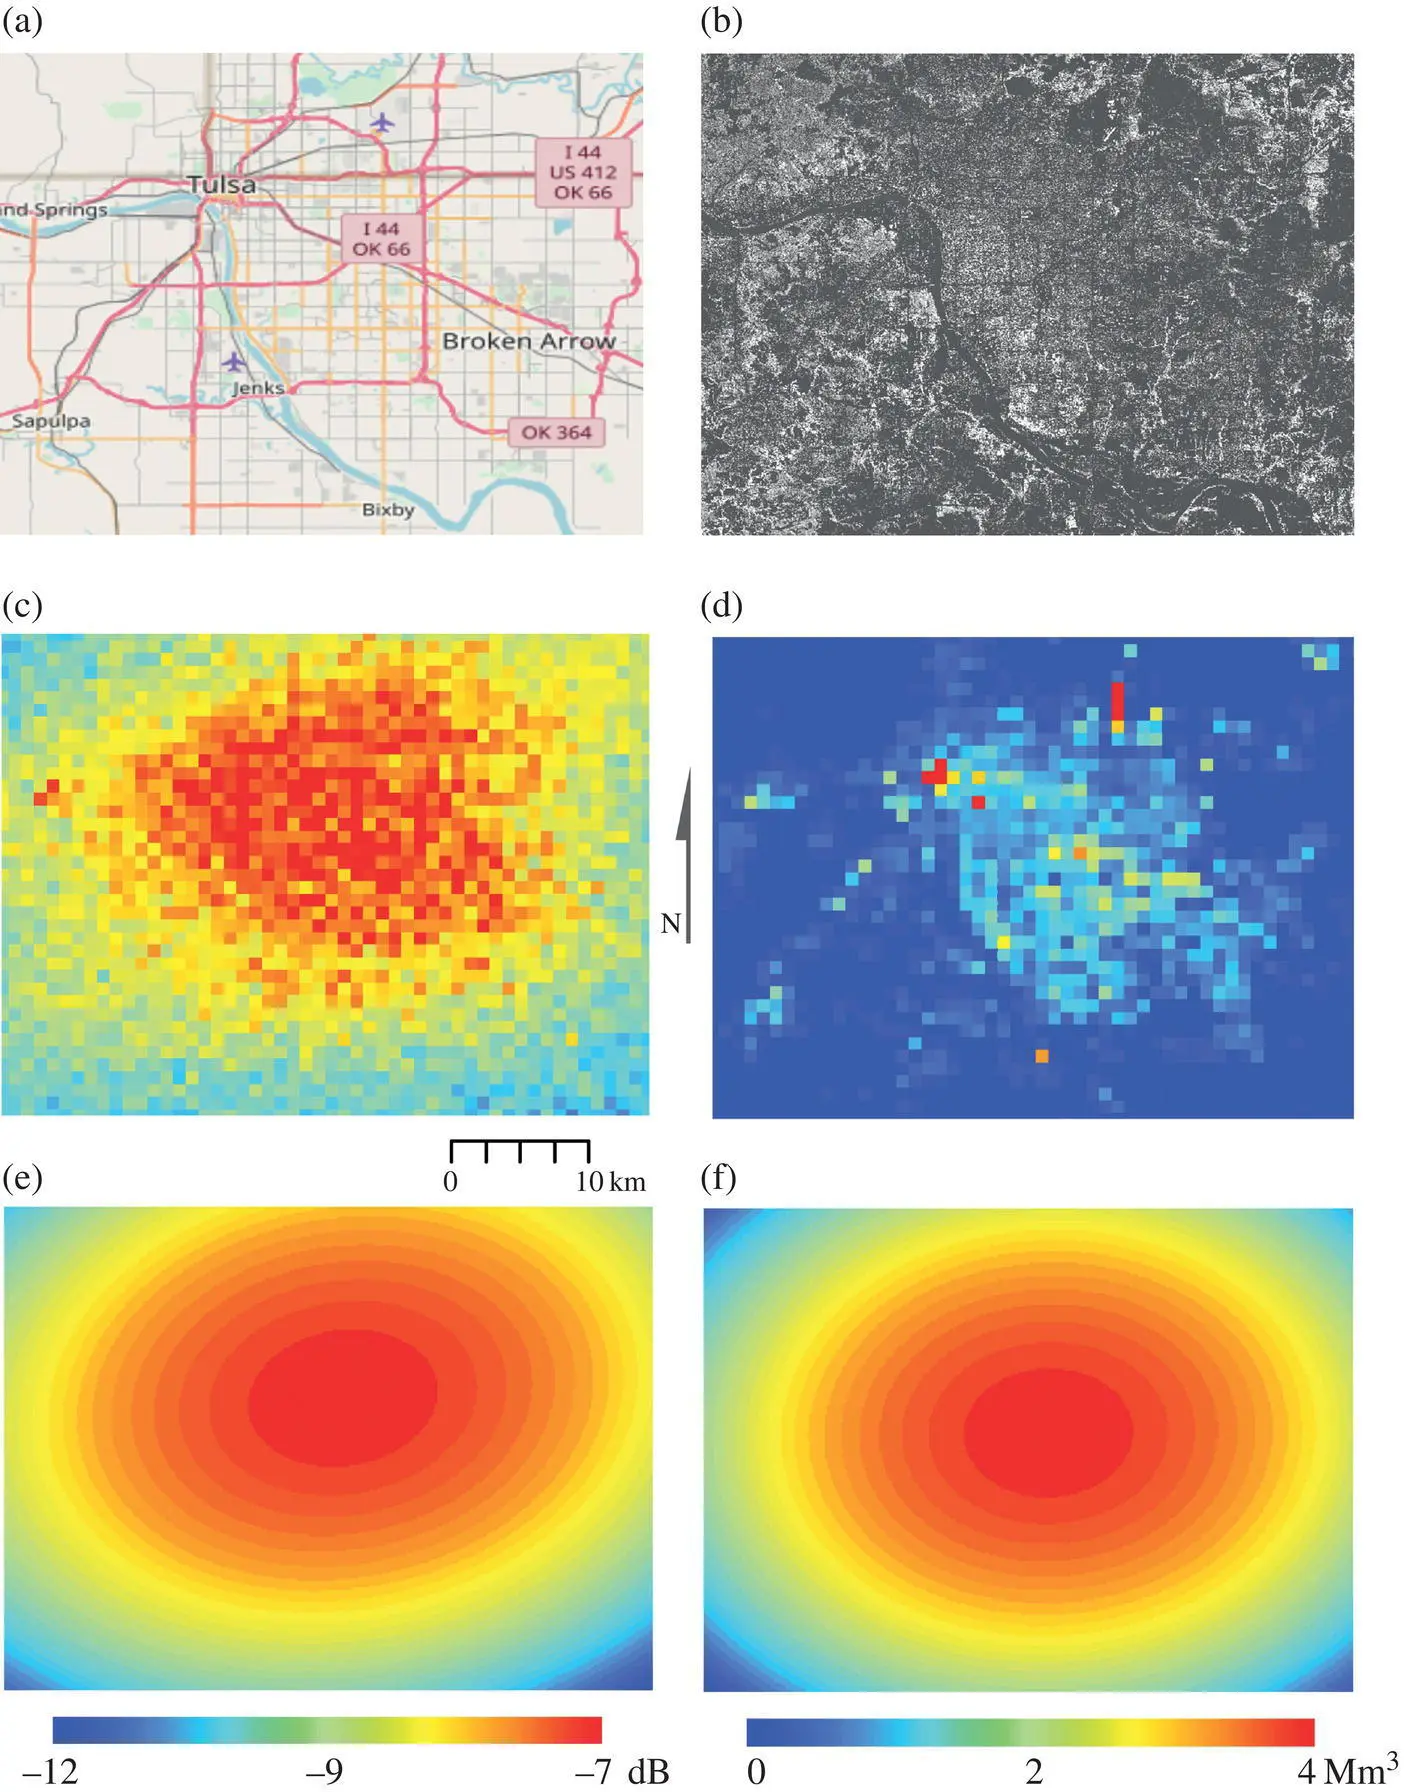
FIGURE 2.10 City and data extents along with raw and processed data and polynomial trend visualizations for Tulsa, Oklahoma for 2008: (a) reference map, (b) 1 m lidar first‐return DHM, (c) 1 km radar DSM, (d) 1 km aggregated lidar data (buildings only), (e) radar trend surface, and (f) lidar trend surface.
Importantly on a global scale, DSM has been used extensively in scientific research in both 2D and 3D for a diverse array of cities. For example, DSM analyses together with demographic data showed a positive relationship with ambient population distribution patterns in Bogotá in Colombia, Dhaka in Bangladesh, Guangzhou in China, and Quito in Ecuador (Nghiem et al. 2009). DSM urban observation products from satellites have been used to measure quantitatively the fourfold increase in urban extent of Beijing (Jacobson et al. 2015; Sorichetta et al. 2020), assess policy efficacy (i.e. clean air for the 2008 Olympics; Sorichetta et al. 2020), quantify changes in Beijing and Shanghai that have led to urban development policy (Nghiem 2015; Sorichetta et al. 2020), evaluate groundwater contamination in Italian cities (Masetti et al. 2015; Stevenazzi et al. 2015), estimate groundwater vulnerability in various future scenarios (Stevenazzi et al. 2017), and capture a real‐estate boom in Almaty (Groisman et al. 2017). Jacobson et al. (2019), using DSM urban data products as input to the Gas, Aerosol, Transport, Radiation, General Circulation, Mesoscale, and Ocean Model (GATOR‐GCMOM), found substantial impacts of urbanization on short‐term weather and pollution in two contrasting megacities of Los Angeles in the United States and New Delhi in India. In the Greater Saigon, Balk et al. (2019) paired census data with DSM and other built‐up layers finding that key indicators of economic development were more positively associated with volumetric changes in urban 3D patterns as detected by DSM than with 2D lateral expansion occurring on the urban periphery. DSM results revealed the formation of an extensive mega urban agglomeration along the Yangtze River and its vicinity consisting of Shanghai, Minhang, Baoshan, Jiading, Kunshan, Suzhou, Changshu, Wuxi, Nantong, Zhangjiagang, Jiangyin, Changzhou, Taizhou, Yangzhou, Nanjing, Ma'anshan, Wuhu, etc., along a swath extending over 450 km from the Pacific coast inland (Nghiem 2015). Over the Po Plain region in Italy, DSM was found to be more efficient than aerial surveys and census data for assessing groundwater vulnerability to pollution (Masetti et al. 2015). In sum, these works attest to the value of the DSM approach in application to urban analyses. The DSM is, therefore, capable of monitoring both small and large cities with differing building characteristics and built‐up patterns under diverse socio‐economic conditions as well as a variety of countries and continents under diverse geophysical conditions (e.g. deltas, valleys, mountains, tropics, deserts, coastal and inland regions, etc.) and climatic regions.
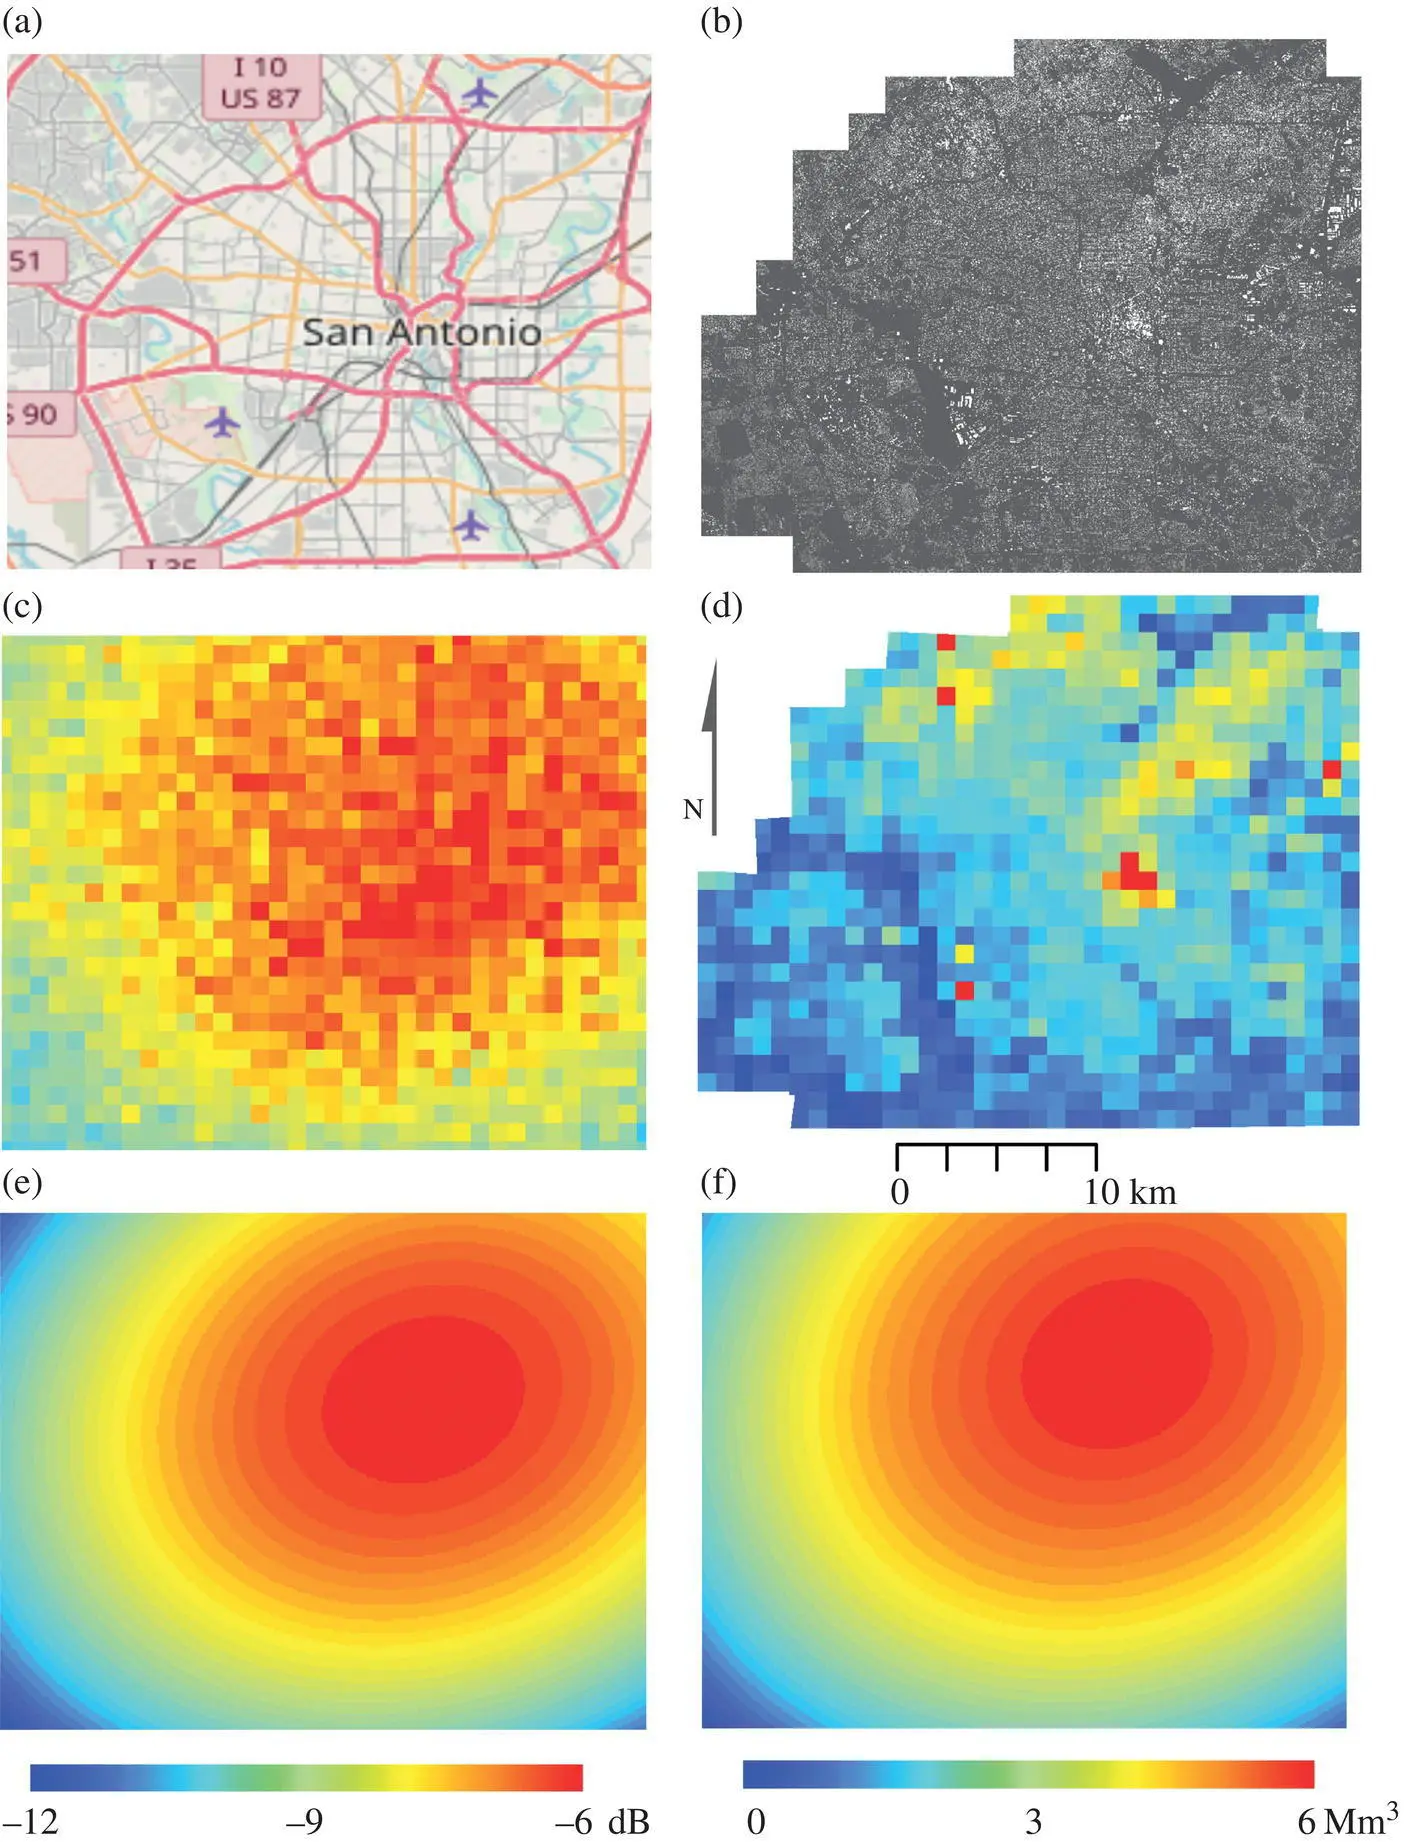
FIGURE 2.11 City and data extents along with raw and processed data and polynomial trend visualizations for San Antonio, Texas, for 2003: (a) reference map, (b) 1 m lidar last‐return DHM, (c) 1 km radar DSM, (d) 1 km aggregated lidar data (buildings only), (e) radar trend surface, and (f) lidar trend surface.
2.4.2.2 Synthetic Aperture Radar (SAR)
While DSM results are applicable to numerous urban issues at the scale of 1 km, other studies require higher spatial resolution in the range of 10–100 m to identify and delineate local features such as detection of buildings along roadsides, in small villages, and on small islands. In this regard, X‐band SAR data such as the current CSK, TerraSAR‐X (TSX) and TDX, and the future LOTUSat‐1 (LS1) and LOTUSat‐2 (LS2) platforms will serve to increase spatial and temporal resolutions of the data with more frequent observations when multiple SAR datasets are used synergistically.
Here, we describe our theoretical approach for remote sensing of 3D urban building volume using satellite SAR data. The advancement here is that this new method can overcome and thus circumvent the limitation of Interferometric Synthetic Aperture Radar (InSAR) to determine building height as InSAR suffers from the overlay problem because buildings are typically constructed vertically (90° slope).
Consider a targeted area A in a high‐resolution SAR measurement with the geometry of the incidence field transmitted toward A and scatter field received from A with receivers at location a and as illustrated in Figure 2.12. For fully polarimetric interferometry measurement of A , the SAR covariance matrix C χis defined with the second‐rank tensor (see Eq. (2.4)):
(2.4) 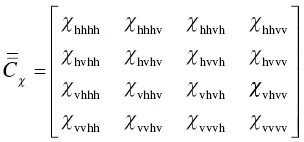
where each element χ is a bistatic polarimetric scattering coefficient, with the horizontal ( h ) or vertical ( v ) polarization of the incidence and scattered fields E , is given by the relation:
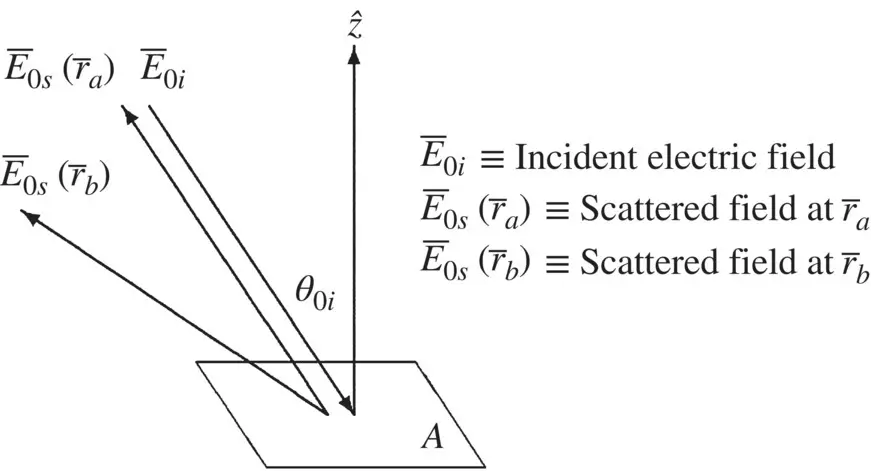
FIGURE 2.12 Geometry of incidence and scattered fields.
(2.5) 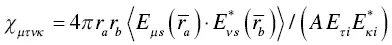
Интервал:
Закладка:
Похожие книги на «Urban Remote Sensing»
Представляем Вашему вниманию похожие книги на «Urban Remote Sensing» списком для выбора. Мы отобрали схожую по названию и смыслу литературу в надежде предоставить читателям больше вариантов отыскать новые, интересные, ещё непрочитанные произведения.


Обсуждение, отзывы о книге «Urban Remote Sensing» и просто собственные мнения читателей. Оставьте ваши комментарии, напишите, что Вы думаете о произведении, его смысле или главных героях. Укажите что конкретно понравилось, а что нет, и почему Вы так считаете.