Urban Remote Sensing
Здесь есть возможность читать онлайн «Urban Remote Sensing» — ознакомительный отрывок электронной книги совершенно бесплатно, а после прочтения отрывка купить полную версию. В некоторых случаях можно слушать аудио, скачать через торрент в формате fb2 и присутствует краткое содержание. Жанр: unrecognised, на английском языке. Описание произведения, (предисловие) а так же отзывы посетителей доступны на портале библиотеки ЛибКат.
- Название:Urban Remote Sensing
- Автор:
- Жанр:
- Год:неизвестен
- ISBN:нет данных
- Рейтинг книги:4 / 5. Голосов: 1
-
Избранное:Добавить в избранное
- Отзывы:
-
Ваша оценка:
Urban Remote Sensing: краткое содержание, описание и аннотация
Предлагаем к чтению аннотацию, описание, краткое содержание или предисловие (зависит от того, что написал сам автор книги «Urban Remote Sensing»). Если вы не нашли необходимую информацию о книге — напишите в комментариях, мы постараемся отыскать её.
is a state-of-the-art review of the latest progress in the subject. The text examines how evolving innovations in remote sensing allow to deliver the critical information on cities in a timely and cost-effective way to support various urban management activities and the scientific research on urban morphology, socio-environmental dynamics, and sustainability.
Chapters are written by leading scholars from a variety of disciplines including remote sensing, GIS, geography, urban planning, environmental science, and sustainability science, with case studies predominately drawn from North America and Europe.
A review of the essential and emerging research areas in urban remote sensing including sensors, techniques, and applications, especially some critical issues that are shifting the directions in urban remote sensing research. Illustrated in full color throughout, including numerous relevant case studies and extensive discussions of important concepts and cutting-edge technologies to enable clearer understanding for non-technical audiences.
will be of particular interest to upper-division undergraduate and graduate students, researchers and professionals working in the fields of remote sensing, geospatial information, and urban & environmental planning.
Urban Remote Sensing — читать онлайн ознакомительный отрывок
Ниже представлен текст книги, разбитый по страницам. Система сохранения места последней прочитанной страницы, позволяет с удобством читать онлайн бесплатно книгу «Urban Remote Sensing», без необходимости каждый раз заново искать на чём Вы остановились. Поставьте закладку, и сможете в любой момент перейти на страницу, на которой закончили чтение.
Интервал:
Закладка:
CHAPTER 2 Examining Urban Built‐up Volume: Three‐Dimensional Analyses with Lidar and Radar Data
Adam J. Mathews1 and Son V. Nghiem2
1 Department of Geography, Environment, and Tourism, Western Michigan University, Kalamazoo, MI, USA
2 NASA Jet Propulsion Laboratory, California Institute of Technology, Pasadena, CA, USA
Abstract
Remotely sensed data products such as satellite images have long been utilized to monitor the urban environment and quantify changes. While useful for certain studies, image‐based approaches often lack three‐dimensional (3D) information (the vertical dimension) for comprehensive analyses of vertical change (1D) in addition to lateral change (2D). This chapter introduces light detection and ranging (lidar)‐based modeling of the urban environment, specifically focusing on quantifying built‐up volume and modeling its change within urban areas using multi‐temporal data. In addition, the chapter introduces readers to recent advancements in incorporating spaceborne radar data (e.g. from satellite scatterometer), validated with lidar data, to monitor built‐up volume free from the limitations of high cost, and small area coverage. Finally, the chapter includes discussion of the physical basis and future extension of high‐resolution data synergistically from multiple satellite synthetic aperture radars (SARs).
2.1 INTRODUCTION
Characterizing and quantifying changes in the urban environment are of the utmost importance as the urban population continues to grow on all continents; from 1950 to 2014, population in urban areas increased from 746 million to nearly four billion (United Nations 2014). Urban population growth, corresponding changes within the urban environment (e.g. increasingly built‐up), and the effects these changes have on the environment require new remote sensing data and methodological approaches. Despite tremendous progress in the field of remote sensing over the past several decades (Gutman et al. 2004), Land Cover/Land Use Change (LCLUC) and Earth surface analyses and modeling efforts have, to date, primarily relied on passive remote sensing data and analysis techniques. Specifically, data are commonly satellite imagery provided by the Landsat series and more recently the Sentinel series, and implemented methods are image classification techniques such as pixel‐ (unsupervised and supervised; Masek et al. 2000) and object‐based approaches (Myint et al. 2011), image ratios/indices (Zha et al. 2003), and night‐time light mapping (Small and Elvidge 2013; Zhang and Seto 2013) that only account for two‐dimensional (2D) Earth surface dynamics.
Importantly, however, in urban environments, the vertical dimension is a vital component to comprehensively evaluate Earth surface processes and their influence on environmental characteristics such as temperature (i.e. urban heat island; Imhoff et al. 2010), precipitation (Kaufmann et al. 2007), air circulation and quality (Jacobson et al. 2019), pollution (Stevenazzi et al. 2015), groundwater vulnerability (Stevenazzi et al. 2014, 2017), and more (e.g. biodiversity, Seto et al. 2012). Urban areas can change in the vertical dimension through upward growth (i.e. new buildings) or downward decline (i.e. demolishing buildings). Unfortunately, data availability issues – mainly, lack of adequate light detection and ranging (lidar) or similar data (e.g. altimetry sensors, photogrammetrically derived Three‐Dimensional (3D) information) – have restricted many remote sensing scientists to 2D examinations due to major data gaps in temporal data records (annual to decadal) and in spatial coverage (regional to global). In addition, other potential 3D data sources, e.g. radio detection and ranging (radar) data of a variety of types and from several satellite platforms, have undergone limited testing for use in urban remote sensing though with promising results (e.g. Gamba and Houshmand 2002; Sportouche et al. 2011; Nghiem et al. 2017; Nguyen et al. 2018; Mathews et al. 2019).
This chapter provides an overview of 3D geospatial data and methodologies for examination of built‐up volume (primarily, buildings) in the urban environment specifically emphasizing lidar‐ and radar‐based approaches. The sections that follow provide background on 3D data sources, delve more deeply into lidar data and methodologies including a brief case study, an equivalent section for radar data and methods, an outlook section discussing future advancements and challenges, and concluding remarks.
2.2 THREE‐DIMENSIONAL (3D) GEOSPATIAL DATA FOR URBAN REMOTE SENSING
While 3D data can be generated from remotely sensed imagery by way of photogrammetric techniques (e.g. photogrammetric bundle‐block adjustment, Structure from Motion computer vision), active remote sensing technologies, such as lidar and radar, provide the bulk of the 3D geospatial data for Earth's surface. With regard to these 3D data, two characteristics become critical for urban remote sensing of built‐up volume and change: (i) spatial resolution and coverage, or the level of detail, allows discrimination of individual buildings and other infrastructure (i.e. highway overpasses, bridges, levees, etc.) for built‐up volume calculation over extensive urban areas, and (ii) temporal resolution, or data collection frequency, enables change detection analyses through multi‐temporal comparisons (e.g. annual data across a decadal record). Correspondingly, Figure 2.1shows previous, current, and future remotely sensed 3D data sources organized by spatial and temporal resolutions, and sized by swath (i.e. width of data collection pass by satellite or airborne platform).
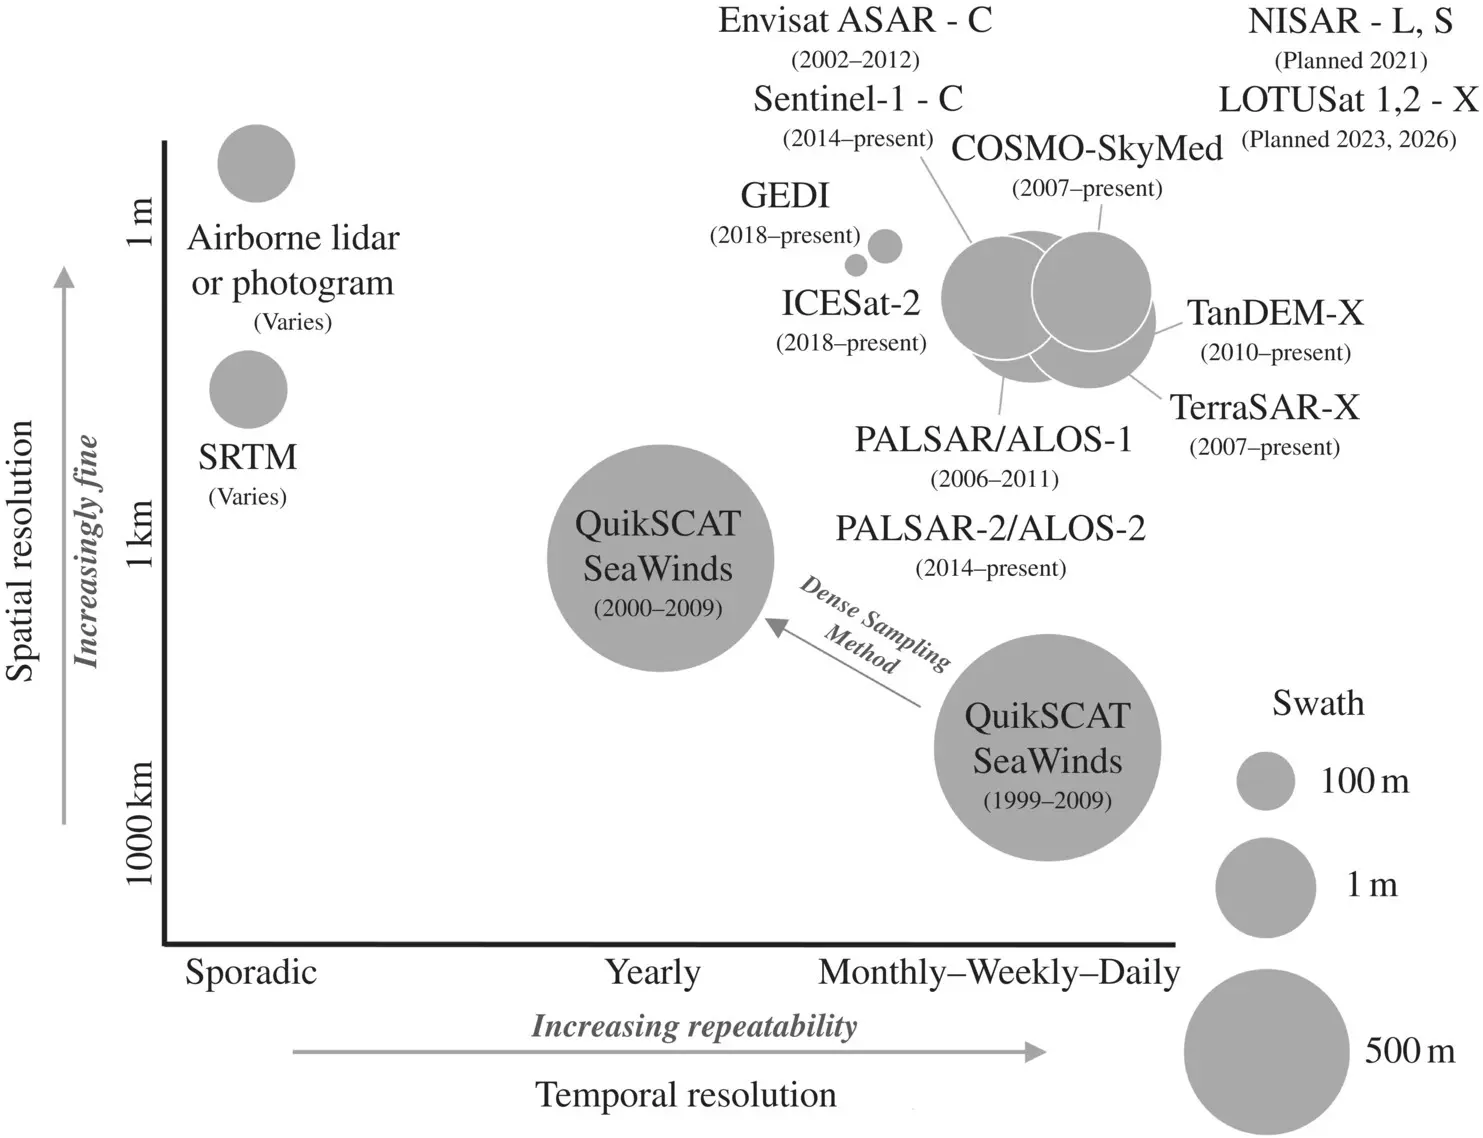
FIGURE 2.1 Current, former, and future 3D data sources for Earth observation. Airborne lidar provide very high spatial resolution but with sporadic temporal frequency. SARs such as COSMO‐SkyMed and TanDEM‐X provide the best options with both high temporal and spatial resolution data. Other SARs are planned to launch in future years, which will provide a multidecadal 3D record from QuikSCAT in 2000 to COSMO‐SkyMed and TanDEM‐X and eventually NISAR and LOTUSats 1 and 2 in the 2020s.
Airborne discrete‐return lidar data provide high spatial resolution data (see Figure 2.1) but is collected on a nonregular basis over small areas due to high cost. Lidar data acquisition is expensive and, regarding multi‐temporal data capture of particular locations for change analyses, is often not repeated for several years unless a specific funding source or project is in place. Multi‐temporal lidar analyses, therefore, commonly need to integrate lidar data from a variety of sources with varying point densities (Gamba et al. 2005). In the United States, government agency‐collected lidar data are often publicly available and free to download, but this is not always the case with other data collectors and holders. Some of these lidar data sources include the following:
Federal governmentUnited States Geological Survey (USGS) through the 3D Elevation Program (3DEP) for topographic mapping National Oceanic and Atmospheric Administration (NOAA) for coastal mappingFederal Emergency Management Agency (FEMA) for flood risk mapping
State governmentMichigan Statewide Authoritative Imagery & LiDAR (MiSAIL) programOregon Department of Geology and Mineral Industries Lidar Program
Regional and local governmentCapital Area Council of Governments (CAPCOG), a 10 county collaboration in central TexasCity of New York (topographic and bathymetric lidar collections in 2017)
Читать дальшеИнтервал:
Закладка:
Похожие книги на «Urban Remote Sensing»
Представляем Вашему вниманию похожие книги на «Urban Remote Sensing» списком для выбора. Мы отобрали схожую по названию и смыслу литературу в надежде предоставить читателям больше вариантов отыскать новые, интересные, ещё непрочитанные произведения.


Обсуждение, отзывы о книге «Urban Remote Sensing» и просто собственные мнения читателей. Оставьте ваши комментарии, напишите, что Вы думаете о произведении, его смысле или главных героях. Укажите что конкретно понравилось, а что нет, и почему Вы так считаете.