Mohamed N. Rahaman - Materials for Biomedical Engineering
Здесь есть возможность читать онлайн «Mohamed N. Rahaman - Materials for Biomedical Engineering» — ознакомительный отрывок электронной книги совершенно бесплатно, а после прочтения отрывка купить полную версию. В некоторых случаях можно слушать аудио, скачать через торрент в формате fb2 и присутствует краткое содержание. Жанр: unrecognised, на английском языке. Описание произведения, (предисловие) а так же отзывы посетителей доступны на портале библиотеки ЛибКат.

- Название:Materials for Biomedical Engineering
- Автор:
- Жанр:
- Год:неизвестен
- ISBN:нет данных
- Рейтинг книги:4 / 5. Голосов: 1
-
Избранное:Добавить в избранное
- Отзывы:
-
Ваша оценка:
Materials for Biomedical Engineering: краткое содержание, описание и аннотация
Предлагаем к чтению аннотацию, описание, краткое содержание или предисловие (зависит от того, что написал сам автор книги «Materials for Biomedical Engineering»). Если вы не нашли необходимую информацию о книге — напишите в комментариях, мы постараемся отыскать её.
A comprehensive yet accessible introductory textbook designed for one-semester courses in biomaterials Materials for Biomedical Engineering: Fundamentals and Applications
Materials for Biomedical Engineering: Fundamentals and Applications
Materials for Biomedical Engineering — читать онлайн ознакомительный отрывок
Ниже представлен текст книги, разбитый по страницам. Система сохранения места последней прочитанной страницы, позволяет с удобством читать онлайн бесплатно книгу «Materials for Biomedical Engineering», без необходимости каждый раз заново искать на чём Вы остановились. Поставьте закладку, и сможете в любой момент перейти на страницу, на которой закончили чтение.
Интервал:
Закладка:
(5.11) 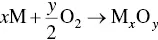
The driving force for the reaction is the free energy change associated with formation of the metal oxide but the growth of the oxide layer is controlled by kinetic factors such as time and temperature. Similarly, ceramics such as silicon nitride (Si 3N 4) that are not composed of a metal oxide, often referred to as nonoxide ceramics, commonly develop a thin oxide surface layer when exposed to an environment containing oxygen.
In an environment containing moisture, such as common ambient conditions of relative humidity 40–50%, the surface of all materials is covered with two to three layers of physically adsorbed water molecules. The outermost, lower‐coordinated metal atoms at a metal oxide surface react with the adsorbed water molecules to form surface hydroxyl (OH) groups in order to increase their coordination ( Figure 5.8). On top of this hydroxylated surface, the water molecules are physically adsorbed by hydrogen bonds. Consequently, prior to implantation, most metals and ceramics used as biomaterials have a surface com posed of OH groups attached to the outermost metal atoms on top of which are physically adsorbed H 2O molecules. The presence of these surface OH groups strongly influences the development of an electrostatic charge on the surface of the biomaterial in an aqueous medium in vitro and in the physiological medium in vivo ( Section 5.4).
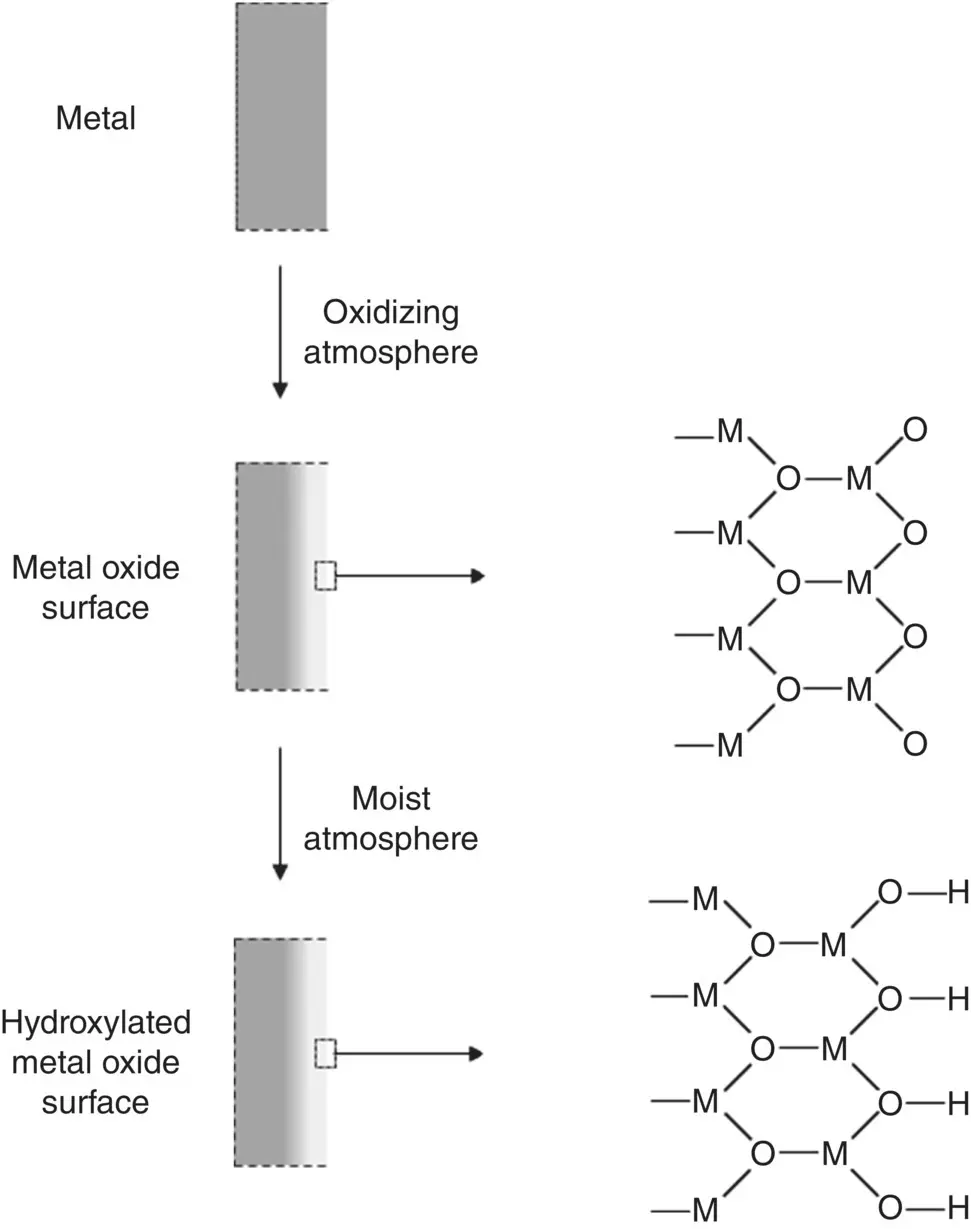
Figure 5.8 Illustration of the formation of an oxide surface layer on a clean metal exposed to an oxidizing atmosphere and a hydroxylated surface upon exposure to a moist atmosphere.
Depending on the nature of the surrounding medium, the polymer chains at the surface of some polymers can undergo structural reorientation of their side groups, which results in a change in surface composition. The thermodynamic driving force for this structural change is the reduction in energy due to a lower interfacial energy between the polymer surface and the medium. However, the rate at which this structural reorientation can occur is a kinetic problem, related to factors such as the flexibility of the chain backbone and the nature of the side groups. Typically, structural reorientation of the side groups occurs faster for polymers composed of single bonds between carbon atoms in the chain backbone and flexible, less bulky side groups. Surface structural reorientation in different polymers has been estimated to take place in time scales ranging from minutes to months.
The occurrence of surface structural reorientation has been studied for polyhydroxyethyl methacrylate (PHEMA), a biomaterial used for contact lenses, which has both hydrophilic and hydrophobic side groups ( Figure 5.9). In air, the hydrophobic side groups are placed preferentially at the surface, resulting in a low surface energy. However, in an aqueous medium, the side groups can reverse their arrangement, presenting the hydrophilic (polar) side groups preferentially at the surface to interact with water molecules of the aqueous medium by hydrogen bonding and polar mechanisms.
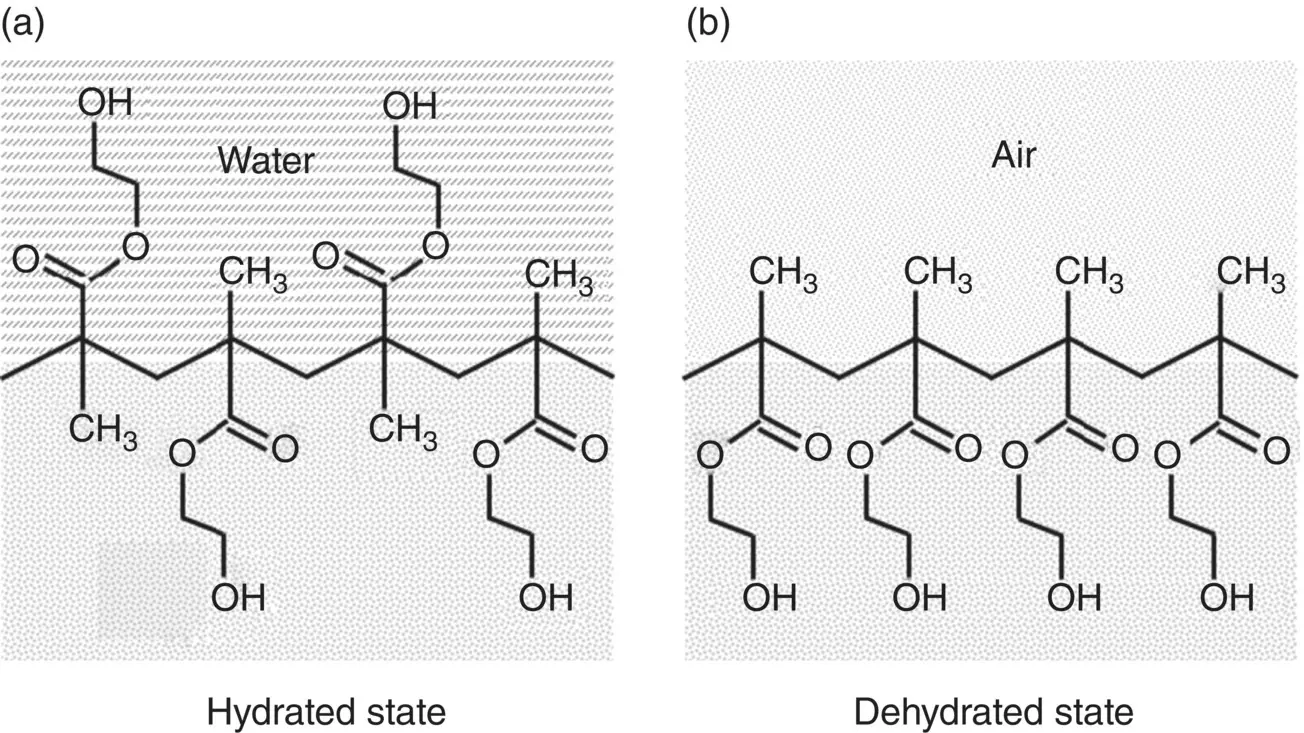
Figure 5.9 A model for reorientation of polymer surface functional groups during dehydration of polyhydroxyethyl methacrylate (PHEMA) hydrogels. The proportion of methyl and hydroxyethyl groups depicted at the polymer surface reflects qualitative changes in surface composition.
Source: From Chen et al. (1999) / with permission of American Chemical Society.
5.3.1 Characterization of Surface Chemistry
In view of the significant role that surface chemistry plays in determining the performance of materials in biomedical applications and engineering applications as well, several techniques are available to study and characterize the surface chemistry of materials. The most common techniques are Auger electron spectroscopy (AES), X‐ray photoelectron spectroscopy (XPS) also referred to as electron spectroscopy for chemical analysis (ESCA), and secondary ion mass spectroscopy (SIMS) ( Table 5.1). AES, XPS, and SIMS are truly surface sensitive techniques in that they provide chemical information about the outermost layer (1–2 nm). They can also provide information from much deeper layers, commonly by sequential or simultaneous removal of surface layers by sputtering the surface with an ion beam and analyzing the sputtered surface, a mode of analysis referred to as depth profiling. A problem with these and most other surface analysis techniques is that they require an ultrahigh vacuum, necessitating the use of dry specimens that often differ in surface chemistry from that of biomaterials implanted in vivo . As noted earlier, in practice, biomaterials are often exposed to the ambient environment for a limited or prolonged period and, consequently, their surface is typically covered with physically and chemically adsorbed water and contaminants such as hydrocarbons.
Table 5.1 Common methods for the surface chemical analysis of materials.
| Measurement parameter | Auger electron spectroscopy (AES) | X‐ray photoelectron spectroscopy (XPS) | Secondary ion mass spectrometry (SIMS) |
|---|---|---|---|
| Incident particle | Electrons (1–20 keV) | X‐rays (1.254 keV; 1.487 keV) | Ions (He +, Ne +, Ar +) (100 eV–30 keV) |
| Emitted particle | Auger electrons (20–2000 eV) | Photoelectrons (20–2000 eV) | Sputtered ions (~10 eV) |
| Element range | >Li ( Z = 3) | >Li ( Z = 3) | >H ( Z = 1) |
| Detection limit | 10 −3 | 10 −3 | 10 −6–10 −9 |
| Depth of analysis | 2 nm | 2 nm | 1 nm |
| Lateral resolution | >20 nm | >150 μm | 50 nm–10 mm |
Auger Electron Spectroscopy (AES)
AES is based on a two‐step mechanism ( Figure 5.10a). Collision of an incident electron beam with the surface of a material leads to the emission of an electron from an inner atomic orbital (binding energy = E 1) leaving a vacant site that is soon filled by an electron from an outer orbital (binding energy = E 2). The energy released in this transition may appear as an X‐ray photon or may be transferred to another electron in an outer orbital (binding energy = E 3) which is ejected with kinetic energy E kgiven by
(5.12) 
The ejected electron is called an Auger electron. The electron ejected from the outer orbital moves through the solid and soon loses its energy through inelastic collisions with bound electrons. On the other hand, if the Auger electron is emitted sufficiently close to the surface of the material, it may escape and be detected using a spectrometer. The number of emitted electrons (or the derivative of the counting rate) is measured and plotted as a function of the kinetic energy of the electron. Since each type of atom has its own characteristic energy levels, the peaks in the observed Auger spectrum can be used to determine the elemental composition of the surface by comparison with standard Auger spectra for the elements.
Читать дальшеИнтервал:
Закладка:
Похожие книги на «Materials for Biomedical Engineering»
Представляем Вашему вниманию похожие книги на «Materials for Biomedical Engineering» списком для выбора. Мы отобрали схожую по названию и смыслу литературу в надежде предоставить читателям больше вариантов отыскать новые, интересные, ещё непрочитанные произведения.


Обсуждение, отзывы о книге «Materials for Biomedical Engineering» и просто собственные мнения читателей. Оставьте ваши комментарии, напишите, что Вы думаете о произведении, его смысле или главных героях. Укажите что конкретно понравилось, а что нет, и почему Вы так считаете.